2. The Basics
2.1. Example 1. - Run individual checks on a single rain gauge
Let’s say you have data for a single rain gauge stored in “hourly_rain_gauge_data.csv” which looks like this:
time |
rain_mm |
|---|---|
2020-01-01 00:00 |
0.0 |
2020-01-01 01:00 |
0.1 |
2020-01-01 02:00 |
0.0 |
2020-01-01 03:00 |
105.0 |
2020-01-01 04:00 |
0.6 |
… |
For the majority of the checks in RainfallQC, you can load in your data using polars and run the checks directly. Below, we run 2 example QC checks:
check_intermittency- to flag years where there are periods of non-zero bounded by 0 (see Figure 1.),
daily_accumulations- to flag accumulations of hourly values into daily.

Figure 1. Example of an intermittency issue within the rainfall record
    import polars as pl
    from rainfallqc import gauge_checks, timeseries_checks

    data = pl.read_csv("hourly_rain_gauge_data.csv")

    intermittent_years = gauge_checks.check_intermittency(data, target_gauge_col="rain_mm")

    daily_accumulation_flags = timeseries_checks.check_daily_accumulations(
        data,
        target_gauge_col="rain_mm",
        gauge_lat=52.0,
        gauge_lon=2.0,
        smallest_measurable_rainfall_amount=0.1,
    )
Please note that some checks may require additional metadata, such as gauge location (latitude and longitude) or smallest measurable rainfall amount (e.g. 0.1 mm). This could look like:
station_id |
latitude |
longitude |
start_datetime |
end_datetime |
path |
|---|---|---|---|---|---|
rain_mm_gauge_1 |
53.0 |
2.0 |
2020-01-01 00:00 |
2024-01-01 00:00 |
path/to/gauge_1.csv |
rain_mm_gauge_2 |
54.1 |
-0.5 |
2018-01-01 00:00 |
2023-01-01 00:00 |
path/to/gauge_2.csv |
rain_mm_gauge_3 |
56.9 |
1.9 |
2015-01-01 00:00 |
2025-01-01 00:00 |
path/to/gauge_3.csv |
… |
… |
… |
… |
You could then run checks that require metadata i.e. the check_hourly_exceedance_etccdi_rx1day QC check which flags rainfall values exceeding
the hourly day rainfall 1-day record at a given location (see Figure 2):
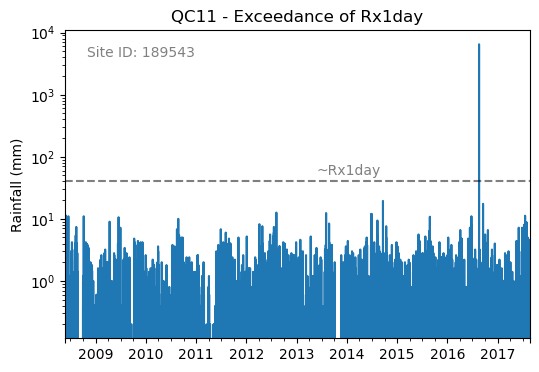
Figure 2. Example of an Rx1day check from the IntenseQC framework
The code for that check looks like:
    import polars as pl
    from rainfallqc import comparison_checks

    data = pl.read_csv("hourly_rain_gauge_data_gauge_1.csv")
    metadata = pl.read_csv("rain_gauge_metadata.csv")

    target_station_id = "rain_mm_gauge_1"
    target_metadata = metadata.filter(pl.col("station_id") == target_station_id)

    rx1day_check = comparison_checks.check_hourly_exceedance_etccdi_rx1day(
         data,
         target_gauge_col=target_gauge_col,
         gauge_lat=target_metadata["latitude"],
         gauge_lon=target_metadata["longitude"]
    )
Output flags will then look like:
time |
rx1day_check |
|---|---|
2020-01-01 00:00 |
0 |
2020-01-01 01:00 |
0 |
2020-01-01 02:00 |
0 |
2020-01-01 03:00 |
1 |
2020-01-01 04:00 |
0 |
… |
… |
2.2. Example 2. - Run individual checks on rain gauge network data (single file)
Let’s say you have data for a multiple rain gauge stored in “hourly_rain_gauge_network.csv” which looks like this:
time |
rain_mm_gauge_1 |
rain_mm_gauge_2 |
rain_mm_gauge_3 |
|---|---|---|---|
2020-01-01 00:00 |
0.0 |
0.5 |
0.0 |
2020-01-01 01:00 |
0.5 |
0.0 |
1.0 |
2020-01-01 02:00 |
0.0 |
1.0 |
0.0 |
2020-01-01 03:00 |
105.0 |
0.0 |
0.5 |
2020-01-01 04:00 |
0.0 |
0.5 |
0.0 |
… |
… |
… |
… |
You can then run checks that compare a target gauge to its neighbours.
To demonstrate, we use the check_wet_neighbours_hourly QC check from neighbourhood_checks.
This check will flag rainfall values that are in excess of a given number of the neighbours (see Figure 3.)
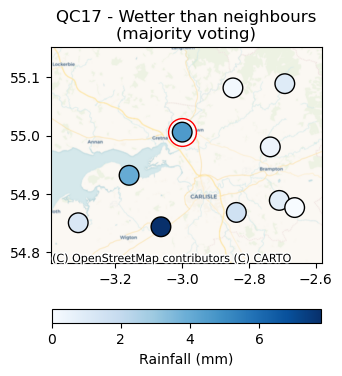
Figure 3. Wetter than neighbors check from the IntenseQC framework.
    import polars as pl
    from rainfallqc import neighbourhood_checks

    data = pl.read_csv("hourly_rain_gauge_network.csv")

    wet_neighbour_flags = neighbourhood_checks.check_wet_neighbours_hourly(
        data,
        target_gauge_col="rain_mm_gauge_1",
        list_of_nearest_stations=["rain_mm_gauge_2", "rain_mm_gauge_3"],
        time_res="hourly",
        wet_threshold=1.0, # threshold for rainfall intensity to be considered
        min_n_neighbours=1, # min number of neighbours needed for comparison
        n_neighbours_ignored=0, # number of neighbours to ignore for comparison
    )
Please note, you will need explicitly define which gauges are considered neighbouring to the target gauge. In Example 3, we show you how you can do this with the get_ids_of_n_nearest_overlapping_neighbouring_gauges function.
2.3. Example 3. - Run individual checks on rain gauge network data (multiple file paths)
Sometimes you may have multiple rain gauge stored in seperate CSV files, and you do not necessarily want to load them all in at once. When this is the case, you need to have a metadata file to store filepaths. You can then use the get_ids_of_n_nearest_overlapping_neighbouring_gauges function to select only the nearest gauges to load in. See an example below where we assume all the CSVs look like example data 1 and the metadata like example metadata 1.
    import polars as pl
    from rainfallqc.utils.neighbourhood_utils import get_ids_of_n_nearest_overlapping_neighbouring_gauges

    data = pl.read_csv("hourly_rain_gauge_network.csv")
    metadata = pl.read_csv("rain_gauge_metadata.csv")

    target_station_id = "rain_mm_gauge_1"

    ten_nearest_neighbour_ids = get_ids_of_n_nearest_overlapping_neighbouring_gauges(
        metadata,
        target_id=target_station_id,
        distance_threshold=50,  # in km
        min_overlap_days=365*5,  # in days
        n_closest=10,  # number of neighbours to return
        start_datetime_col="start_datetime",
        end_datetime_col="end_datetime",
    )

    nearby_metadata = metadata.filter((pl.col('station_id').is_in(ten_nearest_neighbour_ids)) |
                                    (pl.col('station_id') == target_station_id))

    nearby_rainfall_data_list = []
    for path in nearby_metadata['path']:
        one_gauge = pl.read_csv(path, try_parse_dates=True)
        one_gauge = one_gauge.select(['time', 'rain_mm']) # assuming each file has these columns
        gauge_rain_col = path.split('/')[-1].split(f'.csv')[0] # create unique column name
        one_gauge = one_gauge.rename({'rain_mm': gauge_rain_col})
        nearby_rainfall_data_list.append(one_gauge)

    # Join all data together (consider 'how' to merge)
    nearby_rainfall_data = reduce(lambda left, right: left.join(right, on="time", how="left"), nearby_rainfall_data_list)
You can then run checks as normal with that data.
Let’s imagine we run the nearest neighbour correlation QC check (see Figure 4), so for that we also need to compute the nearest neighbour in our data.
To do this we can use the nearby_metadata calculated above and the compute_km_distances_from_target_id function:
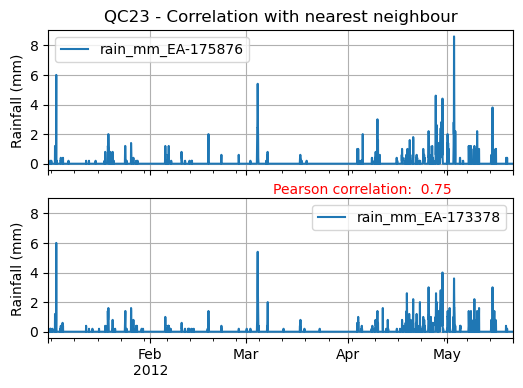
Figure 4. Nearest Neighbour correlation from IntenseQC framework.
    from rainfallqc import neighbourhood_checks
    from rainfallqc.utils.neighbourhood_utils import compute_km_distances_from_target_id

    # get nearest neighbour
    nearby_gauge_distances = compute_km_distances_from_target_id(nearby_metadata, target_id=target_station_id, station_id_col='station_id')
    nearest_neighbour_id = nearby_gauge_distances.sort('distance')[0]['station_id'].item()

    # run QC check
    neighbour_correlation = neighbourhood_checks.check_neighbour_correlation(
                                    nearby_rainfall_data,
                                    target_gauge_col=target_station_id,
                                    nearest_neighbour=nearest_neighbour_id
                                    )