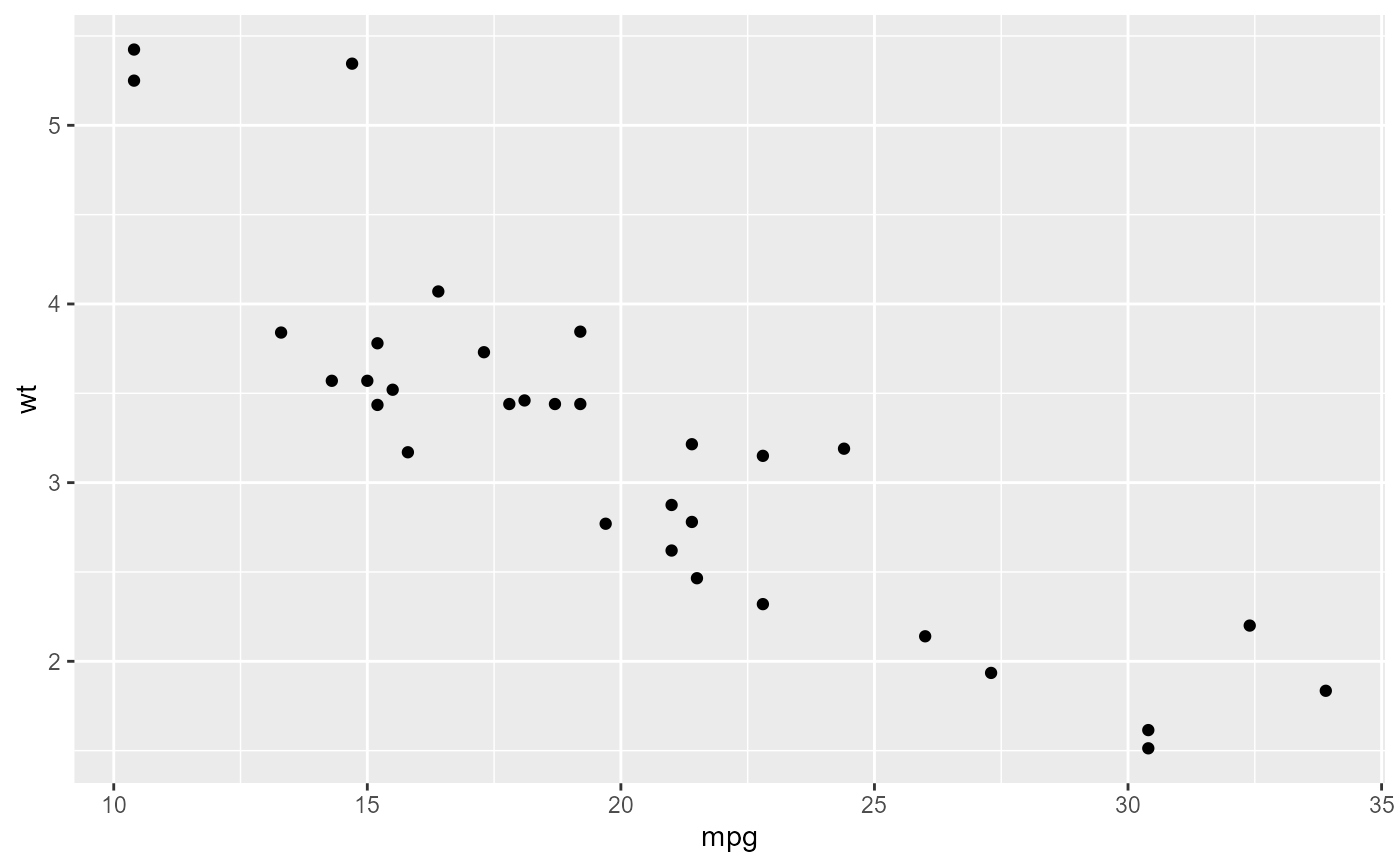
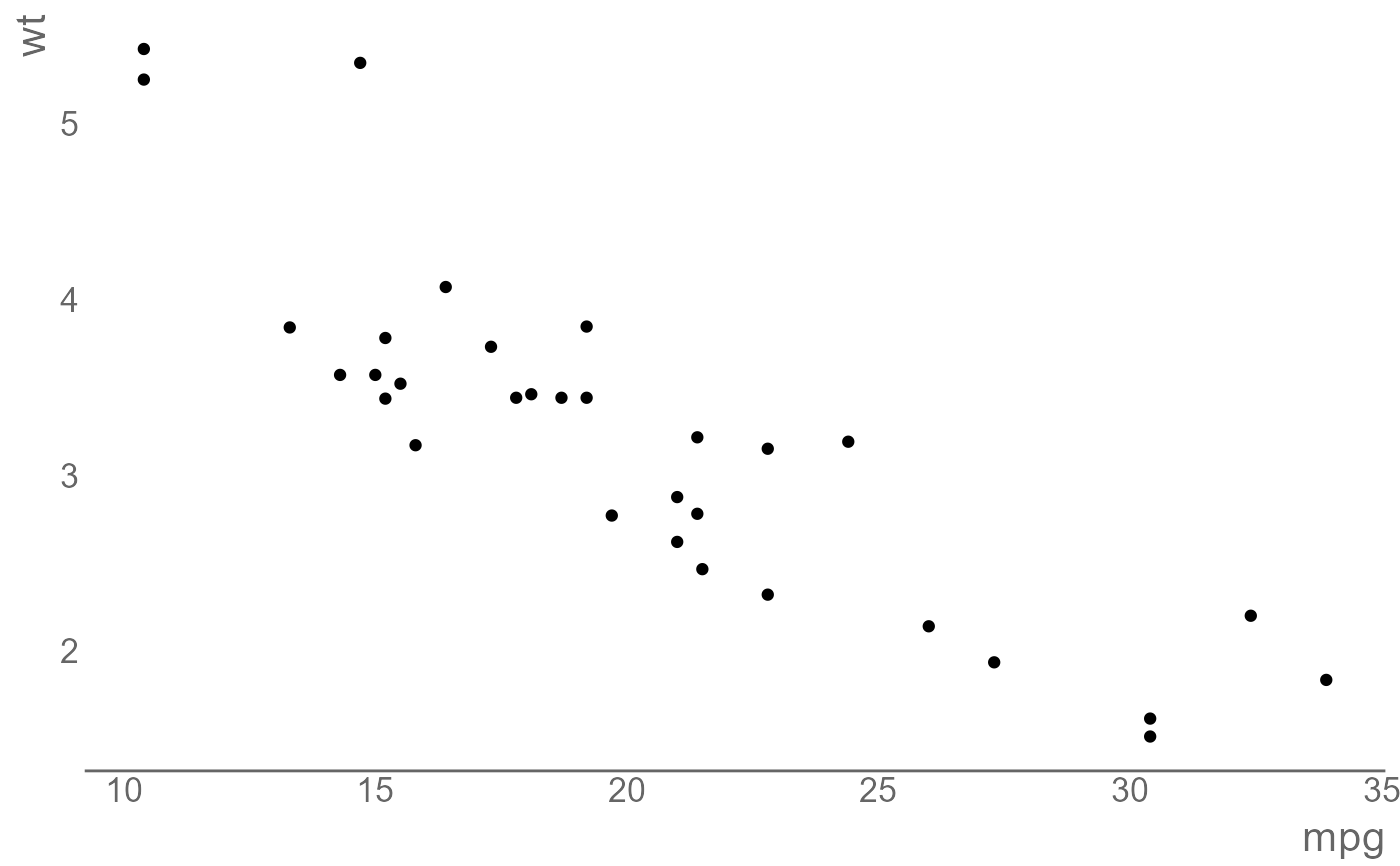
theme_gov A government theme for ggplot2, adopted from # https://github.com/ukgovdatascience/govstyle/blob/master/R/theme_gov.R
theme_gov.Rdtheme_gov Provides a theme for ggplot2 to produce
government style visualisations in ggplot2.
Arguments
- base_size
Integer. Sets the base size of text for the plot. Defaults to
16.- base_colour
Character string. Sets the default colour of axes and axis labels. Must be a named R colour or hexadecimal colour code (e.g. "#FF0000"). Defaults to
gray40.- axes
Character string. Specifies the presence or absence of axes Must be one of
n(no axes),x(only x axis),y(only y axis), orxy(both axes shown).
Value
Will not return anything of itself, but when used in conjuntion
with ggplot and (e.g.) geom_point from the
package ggplot2, will apply styling to a plot.