Challenge and Methodological Approach Summary
The Terrestrial Carbon Pool refers to the total amount of carbon stored in terrestrial (land-based) ecosystems. It is a key component of the global carbon cycle and plays a central role in regulating atmospheric carbon dioxide (CO₂) levels. Key constituents include: vegetation, dead organic matter and soil organic matter. The size of the terrestrial carbon pool is influenced by factors such as land use, climate change, and natural disturbances (e.g., wildfires, pests).
Accessing the relevant data and calculating the risk to the terrestrial carbon pool is one component of giving national and regional stakeholders (policy makers, charities, investors etc.) the right tools and information to make decisions about the implementation of Net Zero policies that balance land-based mitigation against other environmental, social and economic impacts, including the UN Sustainable Development Goals.
This notebook describes and implements a “Risk to Terrestrial C Pool” data pipeline. The Net Primary Production (NPP) is the amount of carbon dioxide that is captured by plants through photosynthesis and converted into organic matter. It is used here to quantify the size of the terrestrial C pool and capture its patterns across space and time.
The following steps are pefromed in the pipeline:
Data Sourcing:
Download and prepare the data needed for the analysis, including MODIS Land Cover and Net Primary Production Products, European Space Agency (ESA) Climate Change Initiative (CCI) Soil Moisture Dataset and Global Standardized Precipitation-Evapotranspiration Index (SPEI) Dataset.
Data Processing:
Calculate probability of drought, vulnerability of NPP to drought and risk posed by drought to NPP.
The user can select to use EO based soil moisture or the standardized precipitation-evapotranspiration index as the drought index
Plot results
Data Directory Creation
The following directories will be created and files downloaded:
temp/ (Temporary files): Primary temporary directory for intermediate files generated during processing.
temp/spei.nc (SPEI data): Standardized Precipitation Evapotranspiration Index (SPEI) data in NetCDF format as a monthly time series.
temp/SM/ (Global soil moisture data): Global soil moisture data in NetCDF format as a weekly time series.
temp/country_name/ (Country-specific EO data): A dedicated subdirectory for each country (for example,
temp/Kenya/,temp/South Africa/) containing downloaded Earth Observation data.temp/country_name/country_name_merged_data.nc (Merged country data): Final merged NetCDF dataset for each country combining annual Net Primary Productivity (NPP), Land Cover (LC), Soil Moisture (SM), and SPEI time series.
Import Libraries and Set Data Directory
A lot of the data for this tutorial is stored as NetCDF files, which is a common file format for gridded land-based data, such as climate and Earth Observation (EO) data. This type of data is handled efficiently by Xarray, a Python package designed for working with multi-dimensional arrays and datasets. The data is stored in a structured format that allows for easy access and manipulation of variables, dimensions, and attributes.
Source
## Importing packages and setting home directory path
homeDir = 'c:\\Users\\jercar\\OneDrive - UKCEH\\VSCode\\Jupyter_Books\\UKCEH_Data_Science_Book\\notebooks\\methods\\NCI_WP2A2\\data\\ncidata\\'

import numpy as np
import xarray as xr
import matplotlib.pyplot as plt
from matplotlib.colors import ListedColormap, BoundaryNorm
from rasterio.enums import Resampling
import warnings
warnings.filterwarnings("ignore")
import pygadm
import folium as fl
import glob
import os
import datetime
import requests as r
import getpass, pprint, time, os, json
import urllib.request
from tqdm import tqdm
Select Area of Interst
## Select Country and level of Administrative Unit
# africa_countries = list(pygadm.get_items(name='africa')['NAME_0'])
country_name = 'Morocco' # <-- Change this to the country you want to download
aoi = pygadm.Items(name=country_name, content_level=0) # content_level=0 for country, content_level=1 for admin level 1, content_level=2 for admin level 2

## Create and set the data directory (dataDir)
dataDir = os.path.join(homeDir, 'temp')
os.makedirs(dataDir, exist_ok=True)

# Plot AOI to confirm it is correct
aoi = aoi.set_crs("EPSG:4326")
m = fl.Map(location=[aoi.geometry.centroid.y.mean(), aoi.geometry.centroid.x.mean()], zoom_start=6)
fl.GeoJson(aoi).add_to(m)
mData Sourcing and Processing
Land Cover (LC) and Net Primary Production (NPP) Data
These data are used to calculate the vulnerability of the terrestrial carbon pool to drought. The data are obtained from the MODIS Land Cover product and NPP product.
The data are downloaded from the NASA Earth Data website. The data are in netcdf format and are projected to the WGS84 coordinate system. The following block of code will download 50-200MB of data depending on the size of the selected country.
Downloading LC and NPP Data
To get access to the data first we create a task in the NASA APPEARs system. When the task is submitted you will receive an email from “appeears
Steps 1-5 are only needed once to create and submit the data request to the NASA Earth Data website. In subsequent runs of the notebook skip to step 6 to download the data.
Authenticate with AρρEEARS API
Source
### Step 1 : Authenticate with AρρEEARS API
# ----------------------------------------------------------------------
api = 'https://appeears.earthdatacloud.nasa.gov/api/'  # Set the AρρEEARS API to a variable
user = getpass.getpass(prompt = 'Enter NASA Earthdata Login Username: ')      # Input NASA Earthdata Login Username
password = getpass.getpass(prompt = 'Enter NASA Earthdata Login Password: ')  # Input NASA Earthdata Login Password
token_response = r.post('{}login'.format(api), auth=(user, password)).json()
Create a list for products to be requested
Notebook Cell
### Step 2 : Create a list for products to be requested
# ----------------------------------------------------------------------
product_response = r.get('{}product'.format(api)).json()                         # request all products in the product service
products = {p['ProductAndVersion']: p for p in product_response} # Create a dictionary indexed by product name & version
prods = ['MOD17A3HGF.061']   # add first product to list
prods.append('MCD12Q1.061')  # add second product to list

### Create tupled list linking desired product with desired layers
layers = []
layers.append((prods[0],'Npp_500m')) # NPP at 500m resolution
layers.append((prods[0],'Npp_QC_500m')) # NPP quality control bits
layers.append((prods[1],'LC_Type5')) # land cover type 5
layers.append((prods[1],'QC')) # land cover quality control bits

print(f'Product {products[prods[0]]}')
Product {'Product': 'MOD17A3HGF', 'Platform': 'Terra MODIS', 'Description': 'Net Primary Production (NPP) Gap-Filled', 'RasterType': 'Tile', 'Resolution': '500m', 'TemporalGranularity': 'Yearly', 'Version': '061', 'Available': True, 'DocLink': 'https://doi.org/10.5067/MODIS/MOD17A3HGF.061', 'Source': 'LP DAAC', 'TemporalExtentStart': '2000-02-18', 'TemporalExtentEnd': 'Present', 'Deleted': False, 'DOI': '10.5067/MODIS/MOD17A3HGF.061', 'Info': {}, 'ProductAndVersion': 'MOD17A3HGF.061'}
Define area of interest -- use the geometry of aoi produced previously
Source
### Step 3 : Define area of interest -- use the geometry of aoi produced previously
# ----------------------------------------------------------------------
nps = aoi.to_json()
nps = json.loads(nps)
Create a task request
Source
### Step 4 : Create a task request
# ----------------------------------------------------------------------
token = token_response['token']                      # Save login token to a variable
head = {'Authorization': 'Bearer {}'.format(token)}  # Create a header to store token information, needed to submit a request

prodLayer = []
for l in layers:
    prodLayer.append({
            "layer": l[1],
            "product": l[0]
          })
prodLayer

# task_name = input('Enter a Task Name: ') # User-defined name of the task: 'NPS Vegetation Area' used in example
task_name = f'{country_name}_NPP_LC' # Harcoded task name

projections = r.get('{}spatial/proj'.format(api)).json()  # Call to spatial API, return projs as json
projs = {}                                  # Create an empty dictionary
for p in projections: projs[p['Name']] = p  # Fill dictionary with `Name` as keys

task_type = ['point','area']        # Type of task, area or point
proj = projs['geographic']['Name']  # Set output projection
outFormat = ['geotiff', 'netcdf4']  # Set output file format type
startDate = '01-01-2000'            # Start of the date range for which to extract data: MM-DD-YYYY
endDate = '12-31-2020'              # End of the date range for which to extract data: MM-DD-YYYY
recurring = False                   # Specify True for a recurring date range

task = {
    'task_type': task_type[1],
    'task_name': task_name,
    'params': {
         'dates': [
         {
             'startDate': startDate,
             'endDate': endDate
         }],
         'layers': prodLayer,
         'output': {
                 'format': {
                         'type': outFormat[1]},
                         'projection': proj},
         'geo': nps,
    }
}
Post json to the API task service and track progress
Source
### Step 5 : Post json to the API task service and track progress
# ----------------------------------------------------------------------
task_response = r.post('{}task'.format(api), json=task, headers=head).json()  # Post json to the API task service, return response as json
params = {'limit': 2, 'pretty': True} # Limit API response to 2 most recent entries, return as pretty json                                                                 # Print task responseget('{}status/{}'.format(api, task_id), headers=head).json() # Call status service with specific task ID & user credentials
task_id = task_response["task_id"]                                               # Set task id from request submission
tasks_response = r.get('{}task'.format(api), params=params, headers=head).json() # Query task service, setting params and header
status_response = r.get('{}status/{}'.format(api, task_id), headers=head).json() # Call status service with specific task ID & user credentials

starttime = time.time()
while r.get('{}task/{}'.format(api, task_id), headers=head).json()['status'] != 'done':
    print(r.get('{}task/{}'.format(api, task_id), headers=head).json()['status'])
    time.sleep(20.0 - ((time.time() - starttime) % 20.0))
print(r.get('{}task/{}'.format(api, task_id), headers=head).json()['status'])
Download the data
## Step 6 : Download the data
# ----------------------------------------------------------------------
task_id = "7b552eda-27e3-4afc-9946-1b2049ccedf7" # Use the task_id from the previous step or the one you want to download
# Set up output directory as dataDir + 'EOdata'
EO_data_dir = os.path.join(dataDir, country_name, 'EO_data')
if not os.path.exists(EO_data_dir):
    os.makedirs(EO_data_dir)  # Create the output directory if it does not exist
if not os.path.exists(EO_data_dir) : os.makedirs(EO_data_dir)     # Create the output directory

files = {}                                                       # Create empty dictionary
bundle = r.get('{}bundle/{}'.format(api,task_id), headers=head).json()  # Call API and return bundle contents for the task_id as json
for f in bundle['files']: files[f['file_id']] = f['file_name']   # Fill dictionary with file_id as keys and file_name as values

for f in files:
    dl = r.get('{}bundle/{}/{}'.format(api, task_id, f), headers=head, stream=True, allow_redirects = 'True')                                # Get a stream to the bundle file
    if files[f].endswith('.tif'):
        filename = files[f].split('/')[1]
    else:
        filename = files[f]
    filepath = os.path.join(EO_data_dir, filename)                                                       # Create output file path
    with open(filepath, 'wb') as f:                                                                  # Write file to dest dir
        for data in dl.iter_content(chunk_size=8192): f.write(data)
print('Downloaded files can be found at: {}'.format(EO_data_dir))
done
Downloaded files can be found at: c:\Users\jercar\OneDrive - UKCEH\VSCode\Jupyter_Books\UKCEH_Data_Science_Book\notebooks\methods\NCI_WP2A2\data\ncidata\temp/Morocco\EO_data
Reading and Plotting LC and NPP Data
Read the data. Set the CRS. Clip data to the area of interest:
EO_data_dir = os.path.join(dataDir,country_name,'EO_data')
LC_ds = xr.open_dataset(f"{EO_data_dir}/MCD12Q1.061_500m_aid0001.nc")
NPP_ds = xr.open_dataset(f"{EO_data_dir}/MOD17A3HGF.061_500m_aid0001.nc")
LC_ds.rio.write_crs("epsg:4326", inplace=True)
NPP_ds.rio.write_crs("epsg:4326", inplace=True)
LC_ds = LC_ds.rio.clip([aoi.geometry.iloc[0]])
NPP_ds = NPP_ds.rio.clip([aoi.geometry.iloc[0]])
Plotting the Net Primary Production (NPP) data:
NPP_ds['Npp_500m'].isel(time=0).plot.pcolormesh(cmap='viridis')
plt.title('MOD17A3HGF NPP 500m Resolution')
plt.show()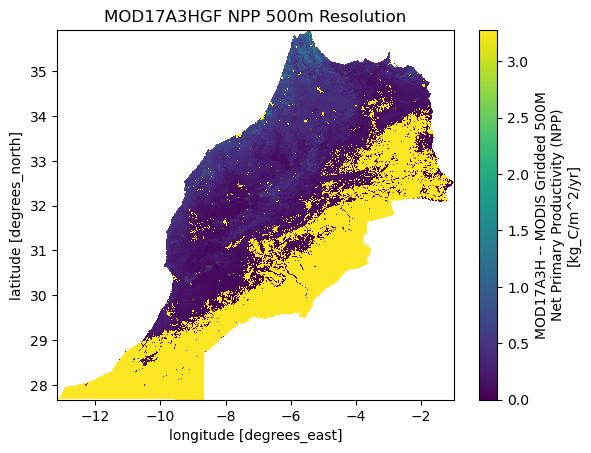
Plot the Land Cover (LC) data:
Source
# Define land cover classes and colors (MODIS LC_Type5)
lc_group_values = [1, 2, 4, 5, 6, 7, 8]
lc_group_labels = [
    "Evergreen Needleleaf",
    "Evergreen Broadleaf",
    "Deciduous Broadleaf",
    "Shrub",
    "Grassland",
    "Cereal Crops",
    "Broadleaf Crops"
]
lc_group_colors = [
    "#006400",  # dark green
    "#228B22",  # forest green
    "#ADFF2F",  # green yellow
    "#BDB76B",  # dark khaki
    "#FFD700",  # gold
    "#FFA500",  # orange
    "#8B4513"   # saddle brown
]

# Get unique classes present in the data
lc_unique = np.unique(LC_ds['LC_Type5'].isel(time=0).values)
lc_unique = lc_unique[~np.isnan(lc_unique)].astype(int)
lc_values_plot = [v for v in lc_group_values if v in lc_unique]
lc_labels_plot = [lc_group_labels[lc_group_values.index(v)] for v in lc_values_plot]
lc_colors_plot = [lc_group_colors[lc_group_values.index(v)] for v in lc_values_plot]

cmap_plot = ListedColormap(lc_colors_plot)
norm_plot = BoundaryNorm(lc_values_plot + [max(lc_values_plot)+1], cmap_plot.N)

fig, ax = plt.subplots(figsize=(6, 4))
im = LC_ds['LC_Type5'].isel(time=0).plot(
    ax=ax, x='lon', y='lat',
    cmap=cmap_plot, norm=norm_plot,
    cbar_kwargs={'ticks': lc_values_plot, 'shrink': 0.7, 'label': ''}
)
ax.set_title(f'Land Cover Type - {country_name}')
# Set tick labels
cbar = im.colorbar
cbar.set_ticks(lc_values_plot)
cbar.set_ticklabels(lc_labels_plot)
plt.show()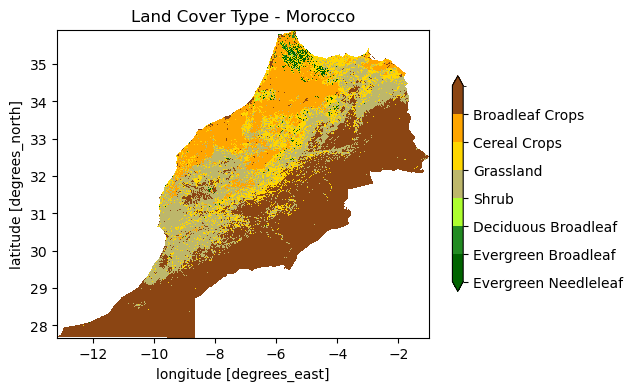
Soil Moisture (SM) data
Soil Moisture data are obtained from the European Space Agency (ESA) Climate Change Initiative (CCI) Soil Moisture dataset. The data are in netcdf format, are projected to the WGS84 coordinate system and cover the entire world (thus, can be downloaded only once when implementing this algorithm for multiple countries). See here for more information on the dataset. The following block of code will download ~ 4.5GB of data.
Downloading SM Data
## Download data for each year between 2000 and 2020
SM_data_dir = os.path.join(dataDir,"SM_data")
os.makedirs(SM_data_dir, exist_ok=True)
if not os.path.exists(SM_data_dir) or not os.listdir(SM_data_dir):
    for year in tqdm(range(2001, 2020+1)):
        # Get all Mondays in the year (ISO week starts on Monday)
        d = datetime.date(year, 1, 1)
        d += datetime.timedelta(days=(0 - d.weekday()) % 7)  # first Monday
        while d.year == year:
            # Format date as YYYYMMDD
            date_str = d.strftime('%Y%m%d')
            # Construct the filename pattern (adjust as needed for actual filenames)
            nc_filename = f"ESACCI-SOILMOISTURE-L3S-SSMV-COMBINED-{date_str}000000-fv09.1.nc"
            url = f"ftp://anon-ftp.ceda.ac.uk/neodc/esacci/soil_moisture/data/daily_files/COMBINED/v09.1/{year}/{nc_filename}"
            # Download directly into the target directory, no subdirs
            urllib.request.urlretrieve(url, os.path.join(SM_data_dir,nc_filename))
            d += datetime.timedelta(days=7)
else:
    print(f"SM data already exists in {SM_data_dir}, skipping download.")
Output
Reading and Plotting SM Data
Read soil moisture data. Resample to monthly-then-annual frequency. Clip to the area of interest.
# Find all NetCDF files in the directory
SM_data_dir = os.path.join(dataDir,"SM_data")
nc_files = sorted(glob.glob(os.path.join(SM_data_dir, '*.nc')))

# Open and combine all NetCDF files along the 'time' dimension (change as needed)
cci_sm = xr.open_mfdataset(nc_files, chunks="auto", combine='by_coords')
cci_sm.rio.write_crs("epsg:4326", inplace=True)

## Resample to monthly mean
cci_sm_monthly = cci_sm.resample(time='1M').mean(dim='time', skipna=True)

## Clip area of interst
cci_sm_monthly = cci_sm_monthly.rio.clip([aoi.geometry.iloc[0]])

## Group by month and calculate the mean and std for each calendar month across all years
sm_clim_mean = cci_sm_monthly.groupby('time.month').mean(dim='time')
sm_clim_std = cci_sm_monthly.groupby('time.month').std(dim='time')

"""Calculate the monthly anomalies
- Soil Moisture Anomaly = (Current SM − Mean SM) / Standard Deviation of SM
- Large negative values (e.g., below -1 or -2 standard deviations) often signify drought
"""
cci_sm_monthly['sm_anomaly'] = ((cci_sm_monthly['sm'] - sm_clim_mean['sm'].sel(month=cci_sm['time.month']))
                                / sm_clim_std['sm'].sel(month=cci_sm['time.month']))

## Reproject and transpose to match the NPP and LC data
cci_sm_annual = cci_sm_monthly.resample(time='Y').mean(dim='time',skipna=True)
SM_ds = cci_sm_annual.rio.reproject('EPSG:4326', shape=(int(NPP_ds.lat.shape[0]), int(NPP_ds.lon.shape[0])),
                                    resampling=Resampling.bilinear, nodata=np.nan)

SM_ds = SM_ds.transpose('time', 'y', 'x')
SM_ds = SM_ds.rename({'y': 'lat', 'x': 'lon'})
SM_ds = SM_ds.sel(time=slice('2001','2020'))
SM_ds = SM_ds.assign_coords(lat=LC_ds.lat, lon=LC_ds.lon, time=LC_ds.time)
Plotting the soil moisture data:
SM_ds.sm_anomaly.isel(time=0).plot.pcolormesh(cmap='viridis')
plt.title('Soil Moisture Anomaly')
plt.show()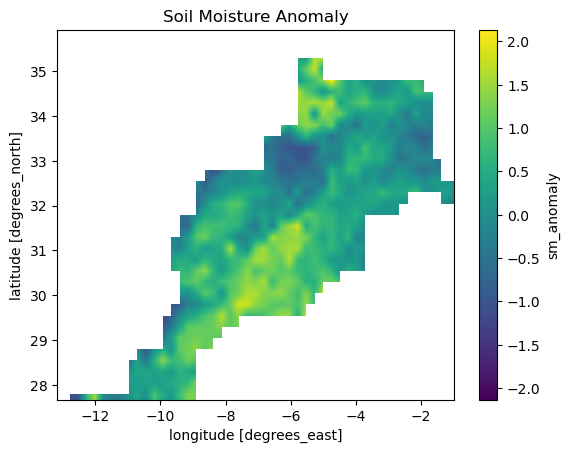
Standardized Precipitation-Evapotranspiration Index (SPEI) Data
The following code downloads the pre-calculated SPEI data from the SPEI database. The data are in netcdf format, are projected to the WGS84 coordinate system and cover the entire world (thus, can be downloaded only once when implementing this algorithm for multiple countries).
Downloading SPEI Data
## Define working directory and SPEI file path
spei_url = "https://spei.csic.es/spei_database/nc/spei12.nc"
spei_path = os.path.join(dataDir, "spei12.nc")
## Download if not already present
if not os.path.exists(spei_path):
    # Use quotes around the path to handle spaces
    urllib.request.urlretrieve(spei_url, spei_path)
    # os.system(f"wget -O \"{spei_path}\" \"{spei_url}\"")
Reading and Plotting SPEI Data
Reading SPEI data:
## Load and process
SPEI = xr.open_dataset(spei_path)
SPEI.rio.write_crs("epsg:4326", inplace=True)
SPEI = SPEI.rio.clip([aoi.geometry.iloc[0]])
SPEI = SPEI.sel(time=slice('2001','2020'))
SPEI = SPEI.rio.reproject('EPSG:4326', shape=(int(NPP_ds.lat.shape[0]), int(NPP_ds.lon.shape[0])),
                          resampling=Resampling.bilinear, nodata=np.nan)
## Resample the 'spei' variable in SPEI to annual mean
SPEI_annual = SPEI.resample(time='1Y').mean()
SPEI_annual = SPEI_annual.rename({'x':'lon','y':'lat'})
SPEI_annual['time'] = NPP_ds['time']
Plotting the SPEI data:
SPEI_annual.spei.isel(time=0).plot.pcolormesh(cmap='viridis')
plt.title('SPEI (mean annual)')
plt.show()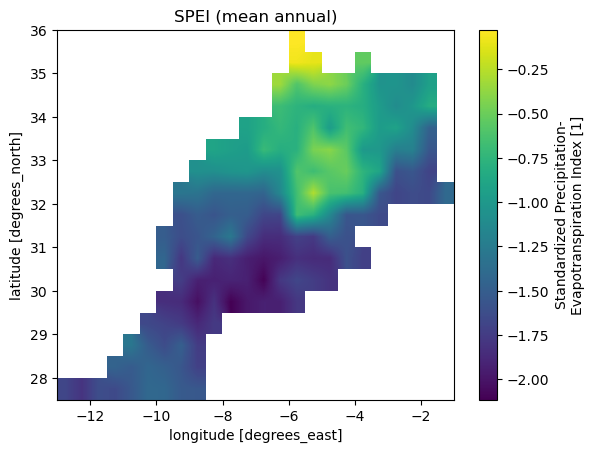
Merging Data
The NPP, LC, Soil Moisture and SPEI data are merged into a single dataset. The dataset is saved as a netcdf file. The resulting netcdf file will vary in size depending on the size of the selected country and can take up to 10GB of space.
## Merge the datasets
ds = xr.merge(objects=[LC_ds.LC_Type5,
                       NPP_ds.Npp_500m,
                       SPEI_annual.spei,
                       SM_ds.sm_anomaly],
              join="override",compat="override",combine_attrs="drop_conflicts")

## Mask water bodies, baren and urban areas out
ds_masked = ds.where(~ds.LC_Type5.isin([0,9,10,11,255]))

## kg C m-2 yr-1 --> t C ha-1 yr-1
ds_masked['Npp_500m'] = ds_masked['Npp_500m'] * 10

## Save the merged dataset to a NetCDF file
# Ensure the directory exists and handle spaces in the path
output_path = os.path.join(dataDir,country_name,f"{country_name}_merged_data.nc")
ds_masked.to_netcdf(output_path, mode='w', format='NETCDF4')
Calculate Risk to Terrestrial C Pool
Risk calculation is performed using the approach presented in van Oijen et al 2013 where the risk is defined as the probability of drought multiplied by the vulnerability of NPP to drought.
The user can choose (1st line in code block below) the drought metric to use for the risk calculation: 1. the Standardized Precipitation-Evapotranspiration Index (SPEI) or 2. the Soil Moisture data.
droughtMetric = 'spei' # sm_anomaly or spei
ds_masked['limit'] = np.nanpercentile(np.array(ds_masked[droughtMetric].data),25) # -1  # np.nanpercentile(data.spei,50)
ds_masked['NPP_non_haz'] = ds_masked.Npp_500m.where(ds_masked[droughtMetric] >= ds_masked['limit']).mean(dim='time', skipna=True)
ds_masked['NPP_haz'] = ds_masked.Npp_500m.where(ds_masked[droughtMetric] < ds_masked['limit']).mean(dim='time', skipna=True)
ds_masked['NPP_vuln'] = ds_masked['NPP_non_haz'] - ds_masked['NPP_haz']
ds_masked['NPP_prob'] = (ds_masked[droughtMetric] < ds_masked['limit']).sum(dim='time') / len(ds_masked.time)
ds_masked['NPP_risk'] = ds_masked['NPP_vuln'] * ds_masked['NPP_prob']
ds_masked['NPP_risk'] = ds_masked['NPP_risk'].where(ds_masked['NPP_risk'] > 0, 0)
Plotting Input Data and Risk to Terrestrial C Pool
Source
### PLOTTING FOR NPP
fig, axs = plt.subplots(2, 3, figsize=(12, 6))

# Plot NPP
ds_masked['Npp_500m'].isel(time=0).plot(ax=axs[0, 0], x='lon', y='lat', cbar_kwargs={'label': r't C ha$^{-1}$ yr$^{-1}$', 'shrink': 0.8})
axs[0, 0].set_title('NPP')

# Plot droughtMetric
ds_masked[droughtMetric].isel(time=-1).plot(ax=axs[0, 1], x='lon', y='lat', cbar_kwargs={'label': droughtMetric, 'shrink': 0.8})
axs[0, 1].set_title(droughtMetric + ' (2020)')

# Only plot classes present in the data
lc_group_values = [1, 2, 4, 5, 6, 7, 8]
lc_group_labels = [
        "Evergreen Needleleaf",
        "Evergreen Broadleaf",
        "Deciduous Broadleaf",
        "Shrub",
        "Grassland",
        "Cereal Crops",
        "Broadleaf Crops"
]
lc_group_colors = [
    "#006400",  # dark green
    "#228B22",  # forest green
    "#ADFF2F",  # green yellow
    "#BDB76B",  # dark khaki
    "#FFD700",  # gold
    "#FFA500",  # orange
    "#8B4513"   # saddle brown
]

lc_unique = np.unique(ds_masked['LC_Type5'].isel(time=0).values)
lc_unique = lc_unique[~np.isnan(lc_unique)].astype(int)
lc_values_plot = [v for v in lc_group_values if v in lc_unique]
lc_labels_plot = [lc_group_labels[lc_group_values.index(v)] for v in lc_values_plot]
lc_colors_plot = [lc_group_colors[lc_group_values.index(v)] for v in lc_values_plot]

cmap_plot = ListedColormap(lc_colors_plot)
norm_plot = BoundaryNorm(lc_values_plot + [max(lc_values_plot)+1], cmap_plot.N)

im_lc = ds_masked['LC_Type5'].isel(time=0).plot(
    ax=axs[0, 2], x='lon', y='lat',
    cmap=cmap_plot, norm=norm_plot,
    cbar_kwargs={'ticks': lc_values_plot, 'shrink': 0.7, 'label': ''},  # Remove label here
)
axs[0, 2].set_title('LC_Type5')
# Set tick labels
cbar = im_lc.colorbar
cbar.set_ticks(lc_values_plot)
cbar.set_ticklabels(lc_labels_plot)

# Plot NPP Vulnerability
im = ds_masked['NPP_vuln'].plot(ax=axs[1, 0], x='lon', y='lat',
    vmin=0, vmax=np.nanpercentile(ds_masked['NPP_vuln'], 99),
    cmap='RdBu_r',
    cbar_kwargs={'label': r't C ha$^{-1}$ yr$^{-1}$', 'shrink': 0.8}
)
axs[1, 0].set_title('Drought Vulnerability')

# Plot Probability
im = ds_masked['NPP_prob'].plot(ax=axs[1, 1], x='lon', y='lat',
    vmin=0, vmax=np.nanpercentile(ds_masked['NPP_prob'], 99),
    cmap='RdBu_r', cbar_kwargs={'label': '0-1 (low-high)', 'shrink': 0.8})
axs[1, 1].set_title('Drought Probability')

# Plot NPP Risk
im = ds_masked['NPP_risk'].plot(
    ax=axs[1, 2], x='lon', y='lat',
    vmin=0, vmax=np.nanpercentile(ds_masked['NPP_risk'], 99),
    cmap='RdBu_r',
    cbar_kwargs={'label': r't C ha$^{-1}$ yr$^{-1}$', 'shrink': 0.8}
)
axs[1, 2].set_title('Drought Risk')

fig.suptitle(f'Risk to NPP ({droughtMetric}) - {country_name}', fontsize=12)
plt.tight_layout()
plt.show()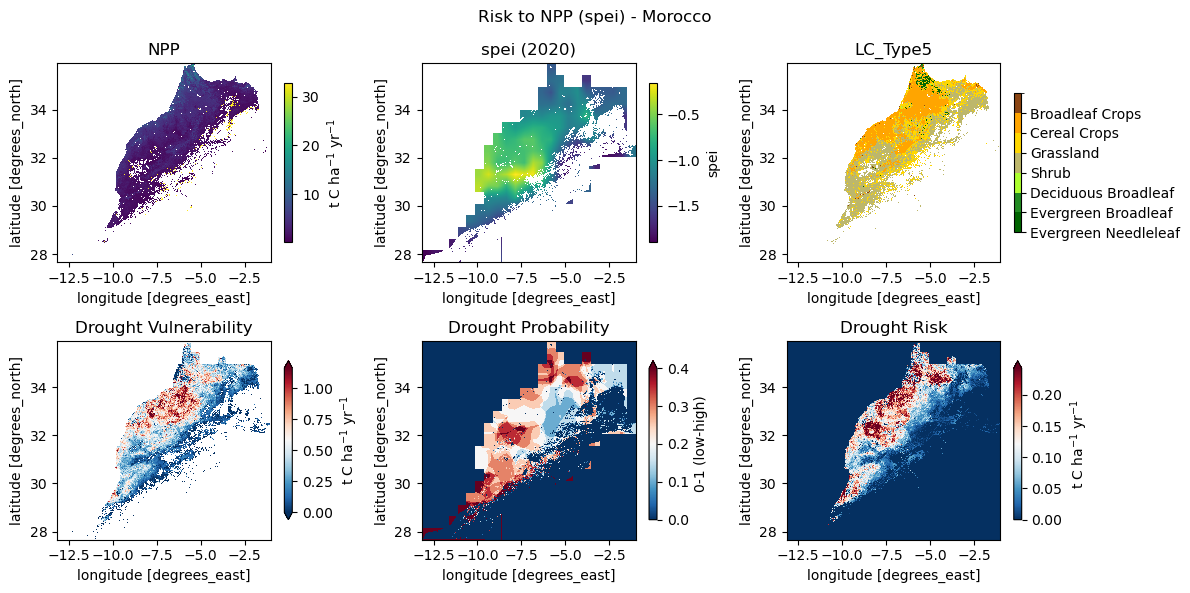
- van Oijen, M., Beer, C., Cramer, W., Rammig, A., Reichstein, M., Rolinski, S., & Soussana, J.-F. (2013). A novel probabilistic risk analysis to determine the vulnerability of ecosystems to extreme climatic events. Environmental Research Letters, 8(1), 015032. 10.1088/1748-9326/8/1/015032