Plot a competition distribution raster
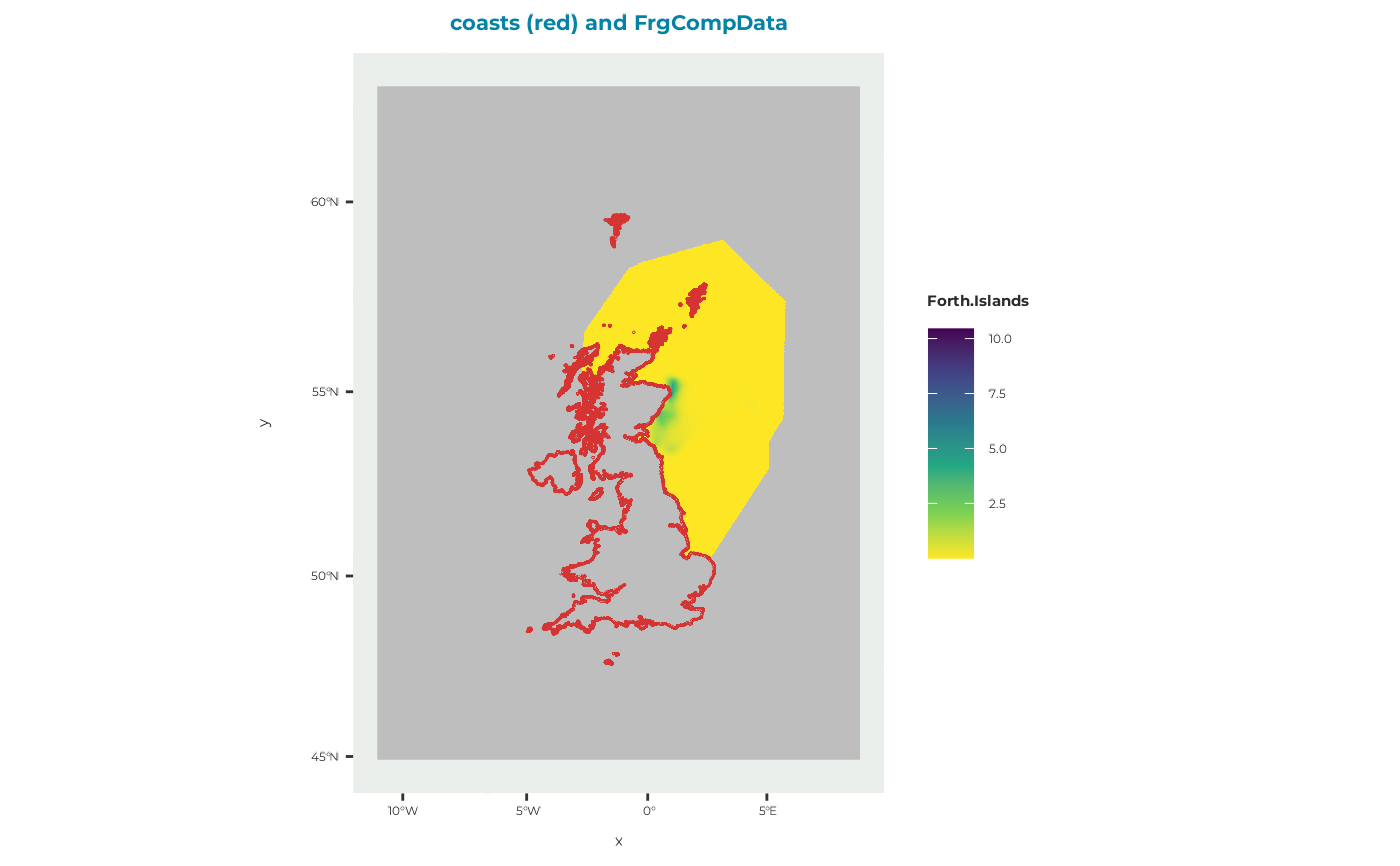
plot_frgcompdata.RdCreates a map of the competition distribution used by seabORD to represent the influence of conspecifics from surrounding colonies on foraging behaviour and intake rates.
Arguments
- frgcompdata
A
RasterLayercontaining competition distribution data, such as the object returned byget_example_frgcompdata().- title
Character string giving the plot title. Defaults to
"coasts (red) and FrgCompData".
Value
A ggplot object showing the competition distribution raster together
with coastlines for geographical context.
Details
The coastline dataset (cef_coast_4326) is reprojected to match the
coordinate reference system of the input raster before plotting.
Competition distribution values are displayed using a viridis colour scale, while cells with a value of zero are displayed as missing values in grey.
See also
get_example_frgcompdata() for loading the example competition
distribution raster.
Examples
# Load example competition distribution data
frgcompdata <- get_example_frgcompdata()

# Create and display the map
plot_frgcompdata(frgcompdata)