Plot a distance-by-sea raster
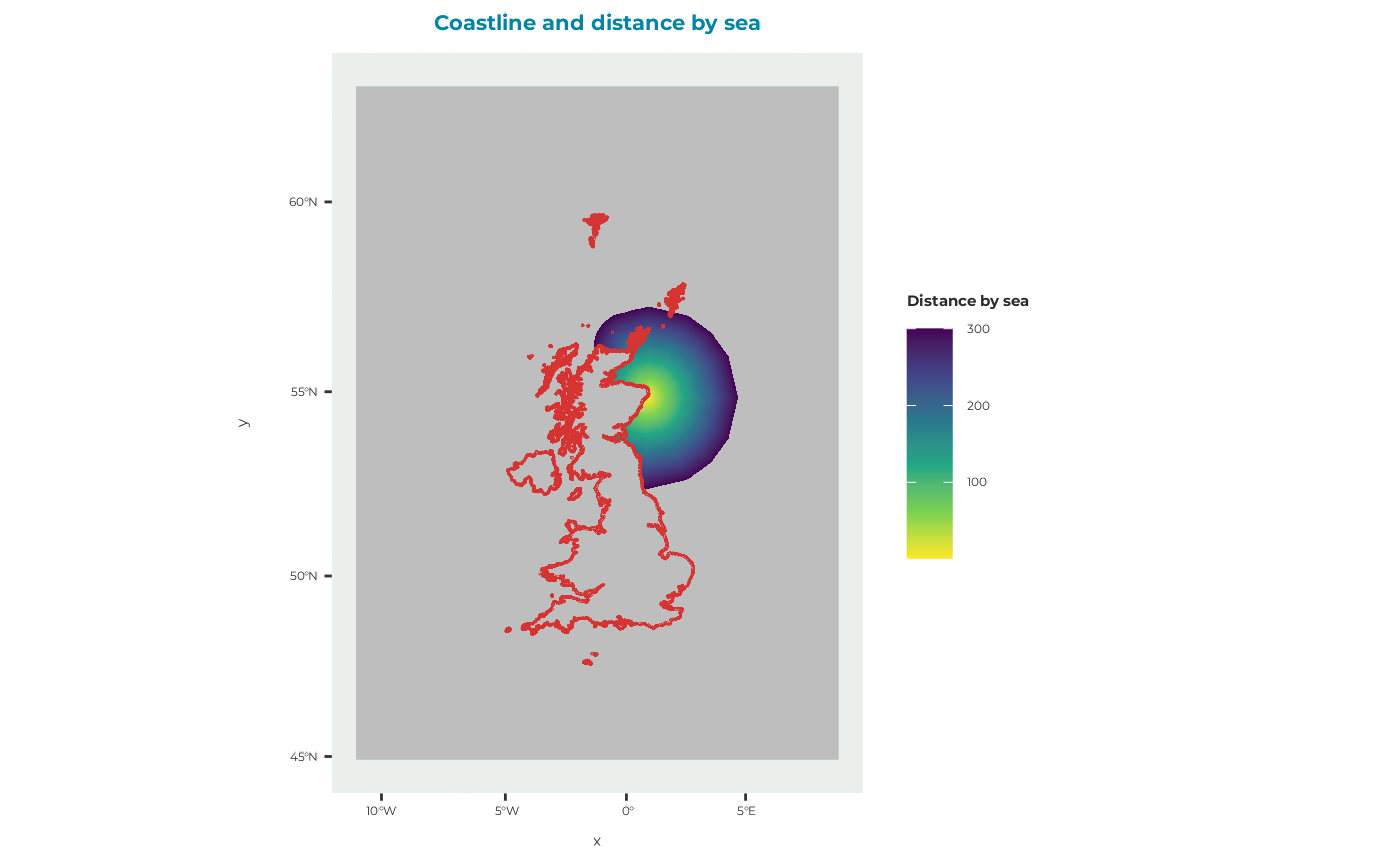
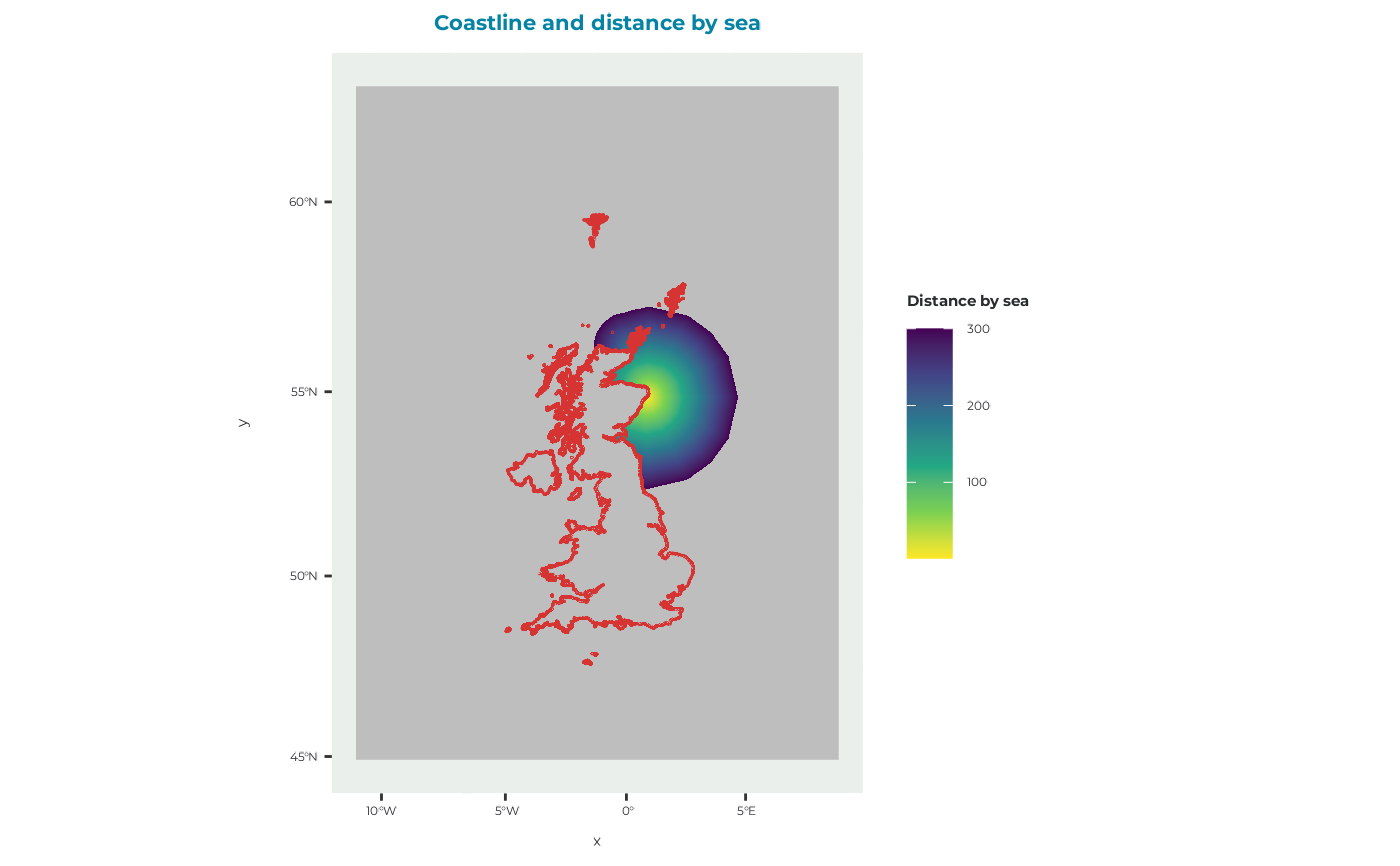
plot_DBS_map.RdCreates a map of distance-by-sea values and overlays coastlines for geographical context.
Arguments
- DBS_map
A raster::RasterLayer object containing distance-by-sea values, such as the object returned by
get_example_DBS_map().- title
Character string giving the plot title. Defaults to
"Coastline and distance by sea".
Value
A ggplot2::ggplot() object showing the distance-by-sea raster and
coastline.
Details
A distance-by-sea raster represents the distance travelled over accessible sea cells rather than the straight-line Euclidean distance between locations.
Raster cells with a value of zero are converted to missing values before plotting. Non-missing values are displayed using a continuous viridis colour scale.
The coastline data supplied with the package are transformed to the
coordinate reference system of DBS_map before plotting.
See also
get_example_DBS_map() for loading example distance-by-sea rasters and
plot_ORD_obstruction() for identifying areas affected by ORD
obstruction.
Other plotting functions:
plot_BirdFlightMap(),
plot_DD_map(),
plot_DD_map_with_ORDs(),
plot_ORD_obstruction(),
plot_ORDpoly(),
plot_adult_body_mass(),
plot_brddata(),
plot_calibration_outputs(),
plot_chick_survival(),
plot_colony_location(),
plot_flight_distance(),
plot_fltdist_base(),
plot_frgcompdata(),
plot_seamask()
Examples
# Load and plot the baseline distance-by-sea raster
DBS_map <- get_example_DBS_map()
plot_DBS_map(DBS_map)
 # Load and plot the distance-by-sea raster containing ORDs
DBS_with_ORDs <- get_example_DBS_map("ords")
plot_DBS_map(DBS_with_ORDs)