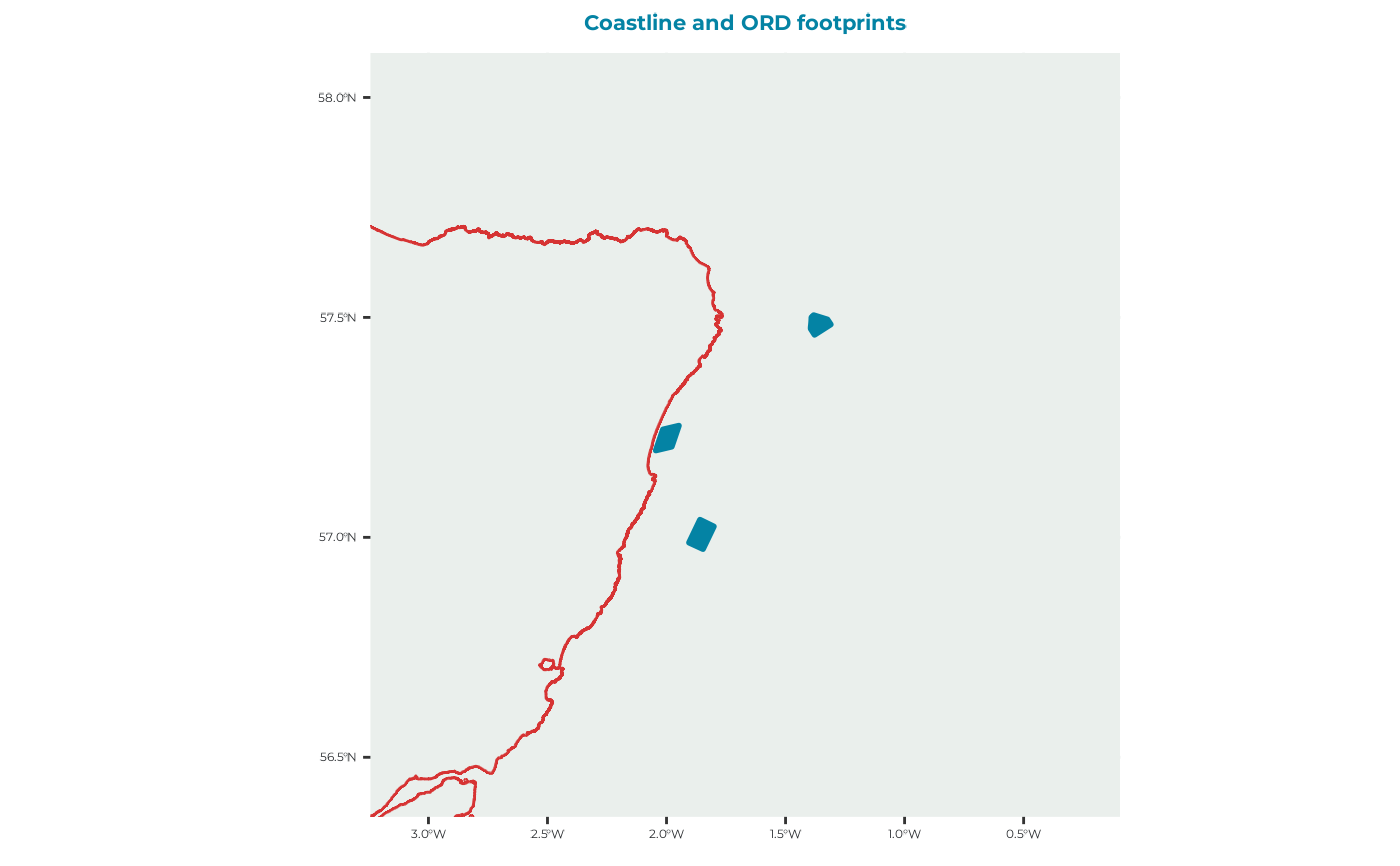
Plot offshore renewable development polygons
plot_ORDpoly.RdCreates a map of offshore renewable development polygons and overlays coastlines for geographical context.
Arguments
- ORDpoly
An
sfpolygon object containing one or more offshore renewable development footprints, such as the object returned byget_example_ORDpoly().- title
Character string giving the plot title. Defaults to
"Coastline and ORD footprints".
Value
A ggplot2::ggplot() object showing the offshore renewable development
footprints and coastline.
Details
The plotting extent is calculated by transforming the ORD polygons to EPSG:3035, applying a 50-km buffer around their combined bounding box, and transforming the resulting extent to the coordinate reference system of the coastline data.
Coastlines are displayed in red and ORD footprints are displayed in blue.
See also
get_example_ORDpoly() for loading example ORD polygons and
plot_DD_map_with_ORDs() for plotting ORD footprints over a
distance-decay surface.
Other plotting functions:
plot_BirdFlightMap(),
plot_DBS_map(),
plot_DD_map(),
plot_DD_map_with_ORDs(),
plot_ORD_obstruction(),
plot_adult_body_mass(),
plot_brddata(),
plot_calibration_outputs(),
plot_chick_survival(),
plot_colony_location(),
plot_flight_distance(),
plot_fltdist_base(),
plot_frgcompdata(),
plot_seamask()
Examples
# Load and plot the standard example ORD polygons
ORDpoly <- get_example_ORDpoly()
plot_ORDpoly(ORDpoly)
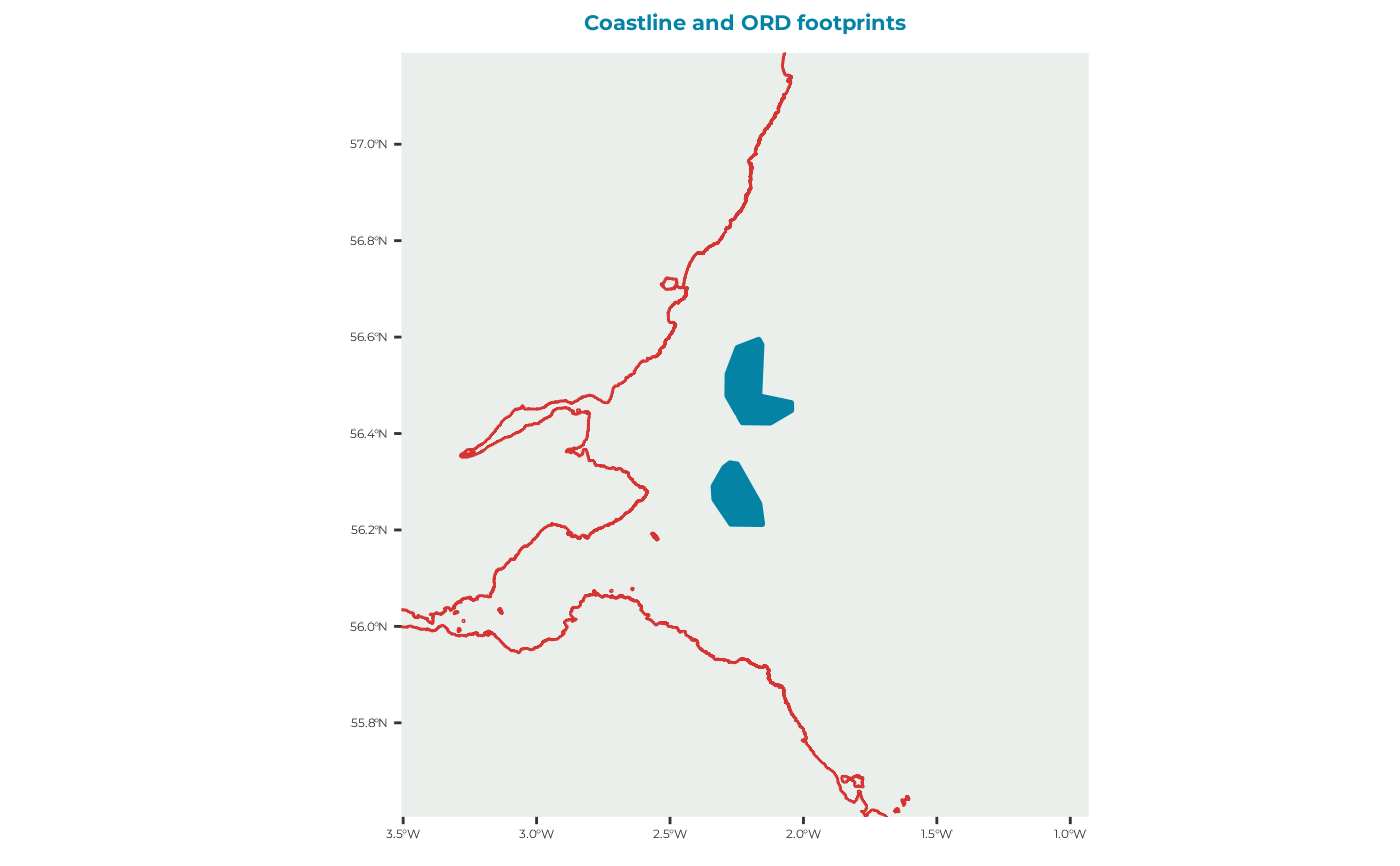 # Load and plot the density-dependence example
ORDpoly_dd <- get_example_ORDpoly("dd")
plot_ORDpoly(ORDpoly_dd)