Plot a bird-distribution raster
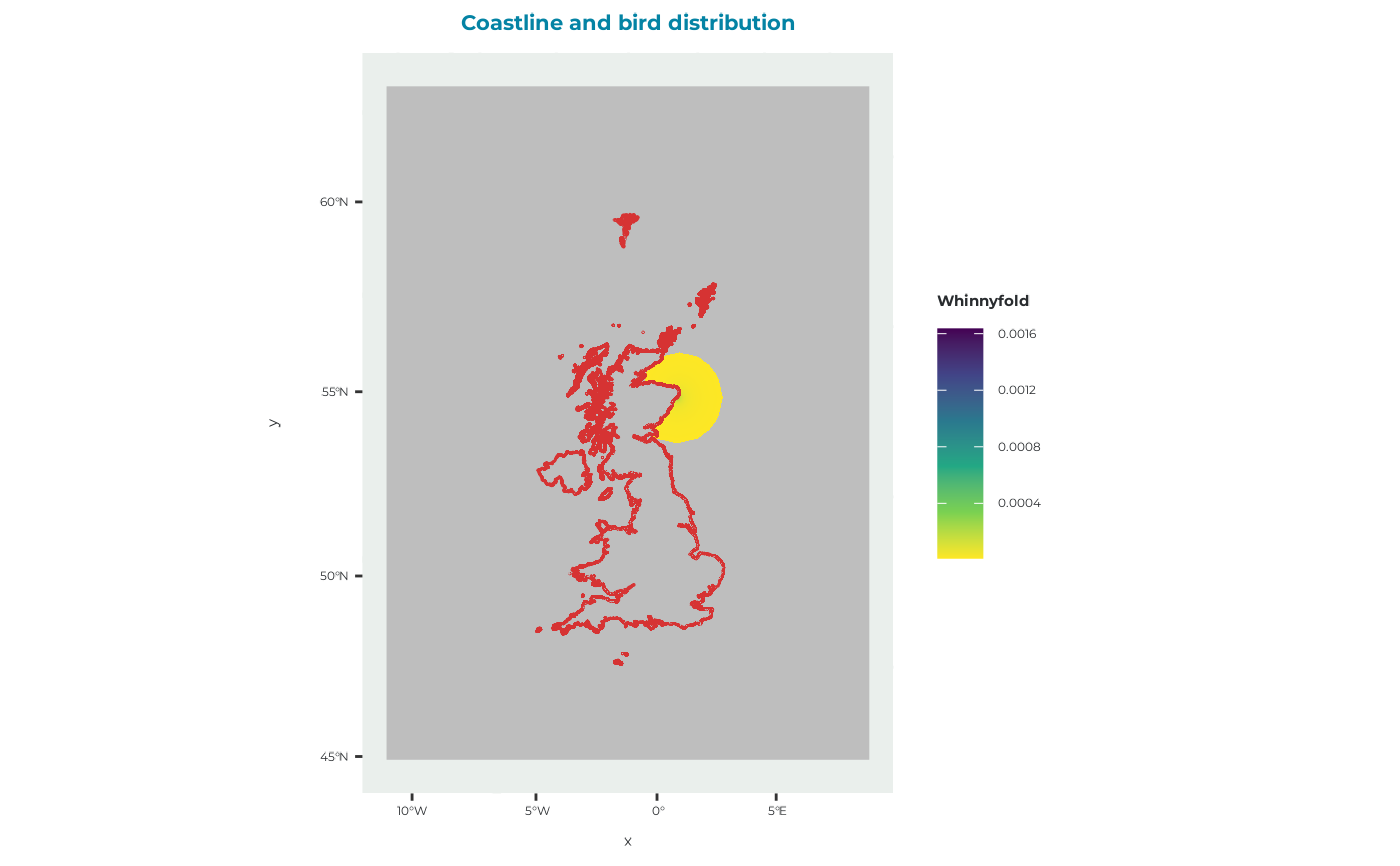
plot_brddata.RdCreates a map of a seabORD bird-distribution raster and overlays coastlines for geographical context.
Arguments
- brddata
A raster::RasterLayer object containing the relative spatial distribution of birds, such as the object returned by
get_example_brddata().- title
Character string giving the plot title. Defaults to
"Coastline and bird distribution".- zoom
Logical. If
TRUE, zooms the map to the extent ofbrddataplus a 10 km buffer. Defaults toFALSE.
Value
A ggplot2::ggplot() object showing the bird-distribution raster and
coastline.
Details
BrdData represents the relative spatial distribution of birds across the
model domain. This distribution may be derived from GPS tracking data or,
where suitable tracking data are unavailable, estimated using a
distance-decay model.
Raster cells with a value of zero are converted to missing values before plotting. Non-missing values are displayed using a continuous viridis colour scale.
The coastline data supplied with the package are transformed to the
coordinate reference system of brddata before plotting.
See also
get_example_brddata() for loading example bird-distribution rasters and
plot_frgcompdata() for plotting the corresponding foraging-competition
distribution.
Other plotting functions:
plot_BirdFlightMap(),
plot_DBS_map(),
plot_DD_map(),
plot_DD_map_with_ORDs(),
plot_ORD_obstruction(),
plot_ORDpoly(),
plot_adult_body_mass(),
plot_calibration_outputs(),
plot_chick_survival(),
plot_colony_location(),
plot_flight_distance(),
plot_fltdist_base(),
plot_frgcompdata(),
plot_seamask()
Examples
# Load and plot the standard example bird distribution
brddata <- get_example_brddata()
plot_brddata(brddata)
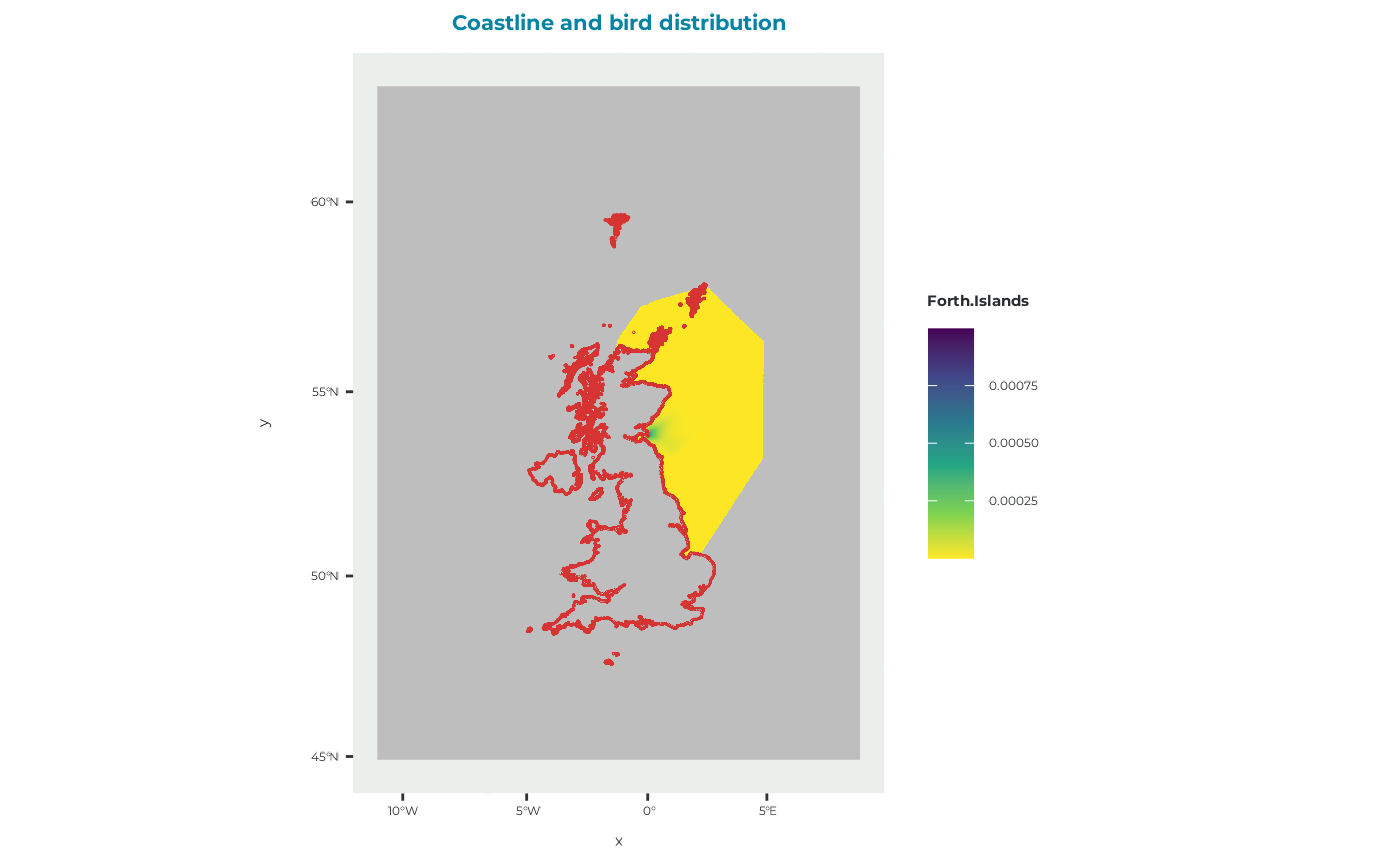 # Load and plot the distance-decay example
brddata_dd <- get_example_brddata("dd")
plot_brddata(brddata_dd)