Section 8 Agricultural Census
Agricultural Census data provide annual records of the total area in the main agricultural land uses. The Agricultural Census is conducted in June each year by the government agriculture department in each of the DAs. Farmers declare the agricultural activity on their land in the form of ca. 150 items of data via a postal questionnaire. The results are collated at national scale. This is a long-running data set with near-complete coverage of agricultural land, relatively consistent over time. The Agricultural Census data are reported as national statistics and to the FAO. Hence it is desirable for our estimates of land-use change to be consistent with these data as far as possible. The classifications used differ by DA, and have varied over time, but the table below summarises the correspondence between the most consistently used Agricultural Census classes and LULUCF classes.
| LULUCF_ID | LULUCF_name | AgCensus_name |
|---|---|---|
| 1 | woods | Woodland |
| 2 | crops | Total.crops |
| 2 | crops | Uncropped.arable.land..No.set.aside.1983.1989…f. |
| 3 | grass | Temporary.grass..sown.in.the.last.5.years. |
| 3 | grass | Land.used.for.outdoor.pigs..g. |
| 3 | grass | Grass.over.5.years.old |
| 4 | rough | Common.rough.grazing..e. |
| 4 | rough | Sole.right.rough.grazing |
Some step changes occur in the data because of methodology changes, and the data may be reported twice for that year, from the two different methods. To remove the effect of these step changes from the data, the difference each step change makes is calculated and the difference applied to all older data. Where a step change appears in the data without any reported methodological change, the time series is smoothed to remove the disjunct, which is assumed to be an artefact of unknown methodological change. A GAM model is fitted to the data set prior the step change, and separately fitted to the data set after the step change. The difference between the two smoothed predictions at the time of the step change is used to estimate the magnitude of the artefact. This is removed from the data set prior to the step change. Clearly there is some subjectivity in this procedure, and further analyis time could be spent on this. However, some smoothing of the data is required, because several changes are cannot be taken at face value as true land-use change. Results for each DA are shown below.
8.1 Results
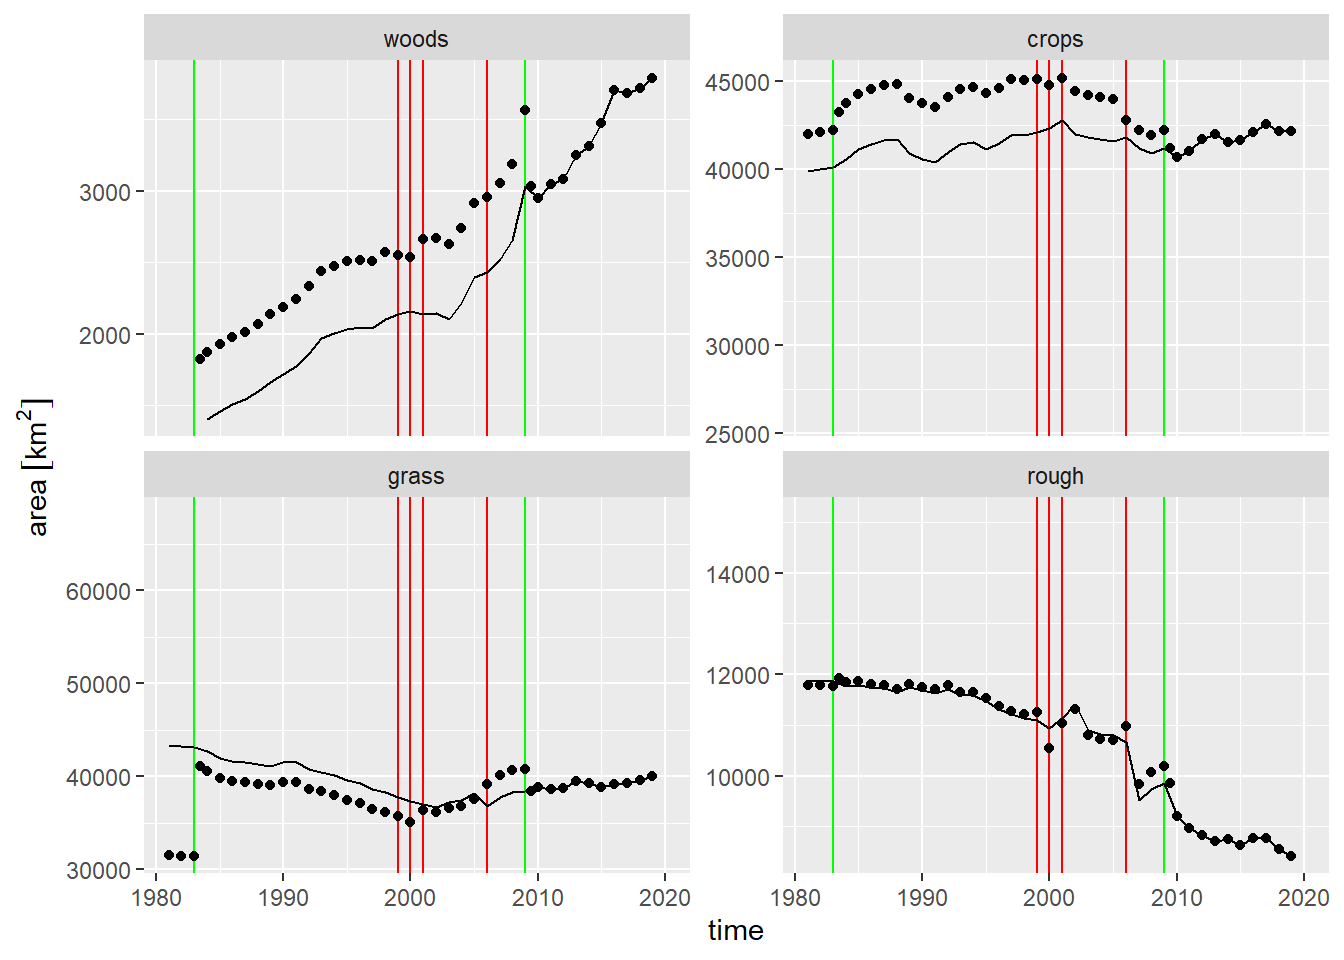
Figure 8.1: Time series of land use from the June Agricultural Census in England, 1980-2019. Points show uncorrected data; lines show corrected data; Green vertical lines show known step changes; Red vertical lines show suspected step changes which have been adjusted for.
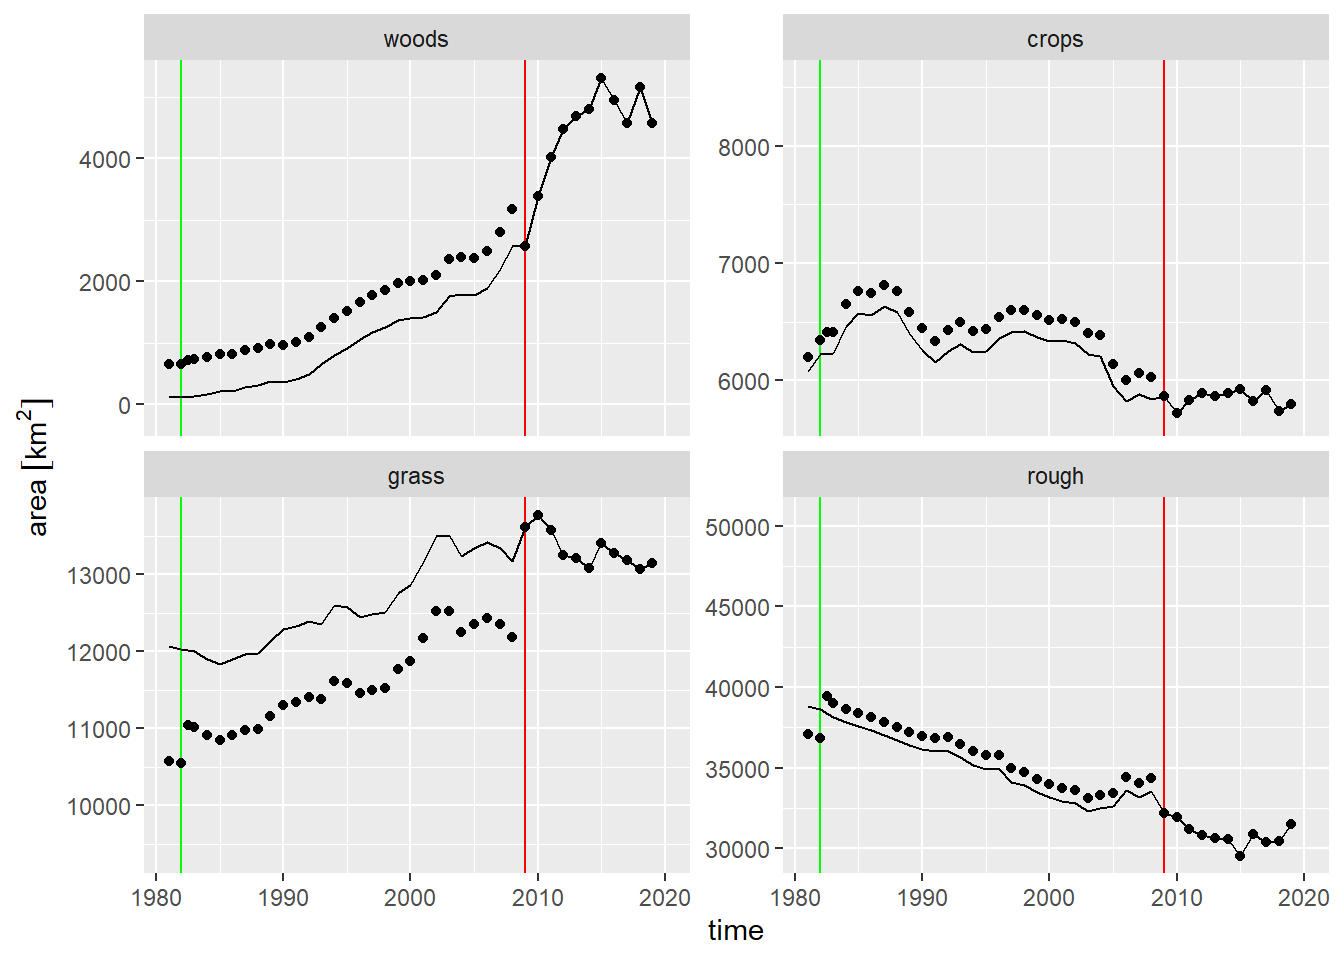
Figure 8.2: Time series of land use from the June Agricultural Census in Scotland, 1980-2019. Points show uncorrected data; lines show corrected data; Green vertical lines show known step changes; Red vertical lines show suspected step changes which have been adjusted for.
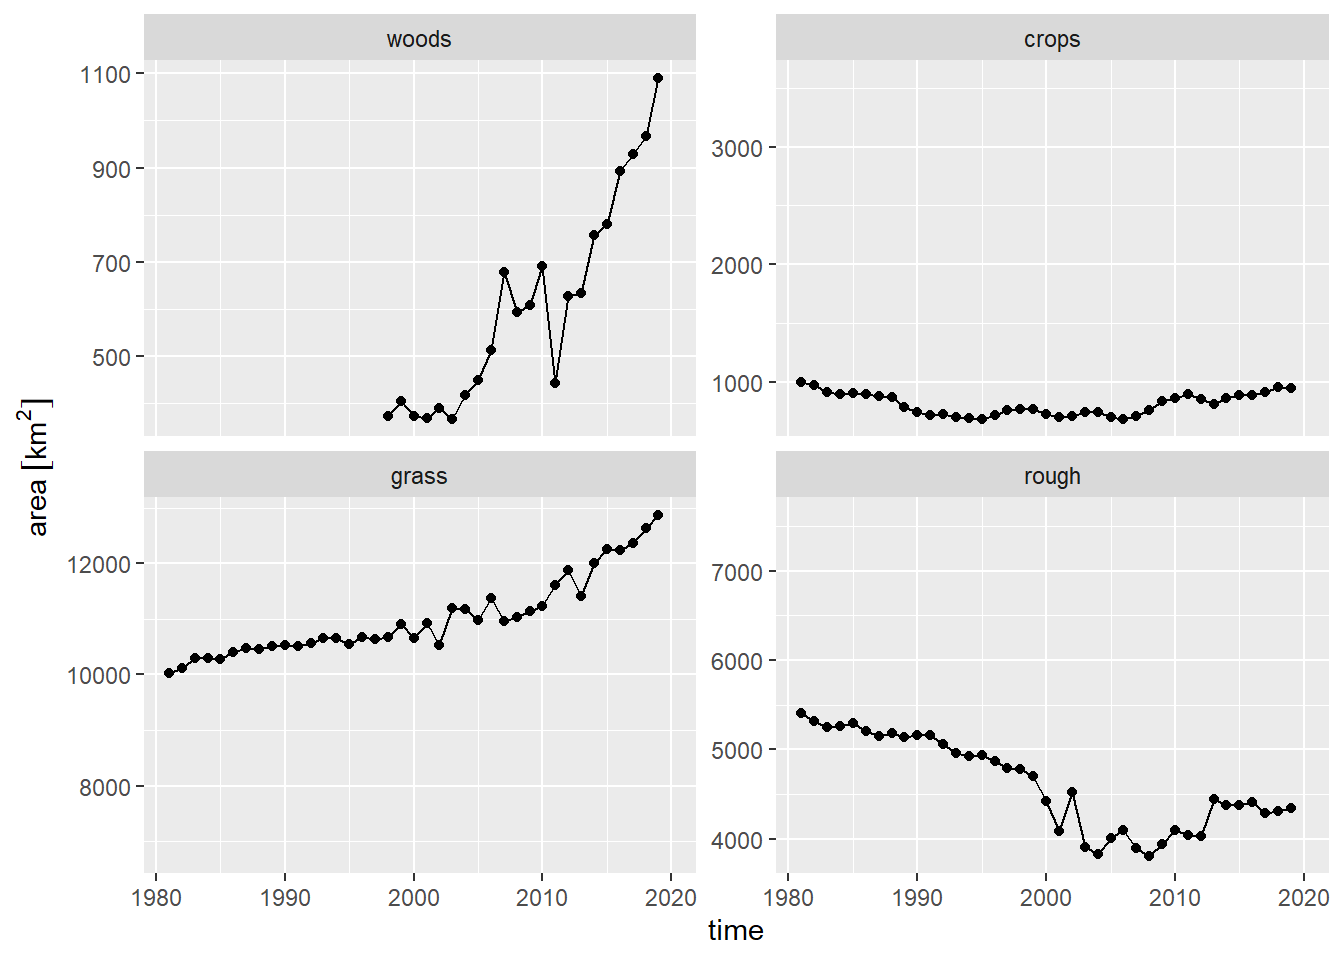
Figure 8.3: Time series of land use from the June Agricultural Census in Wales, 1980-2019.
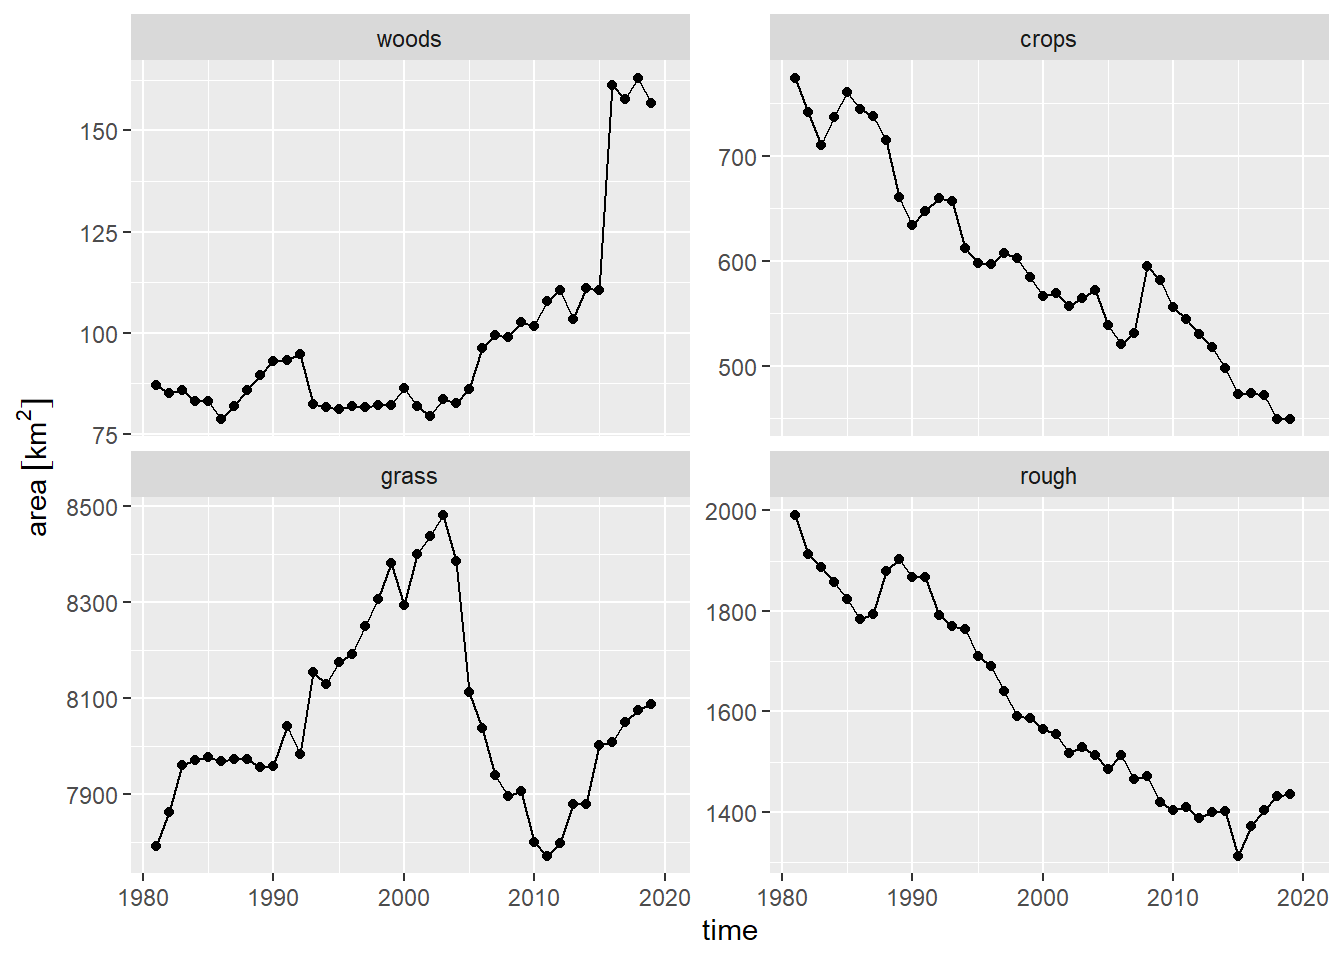
Figure 8.4: Time series of land use from the June Agricultural Census in Northern Ireland, 1980-2019.
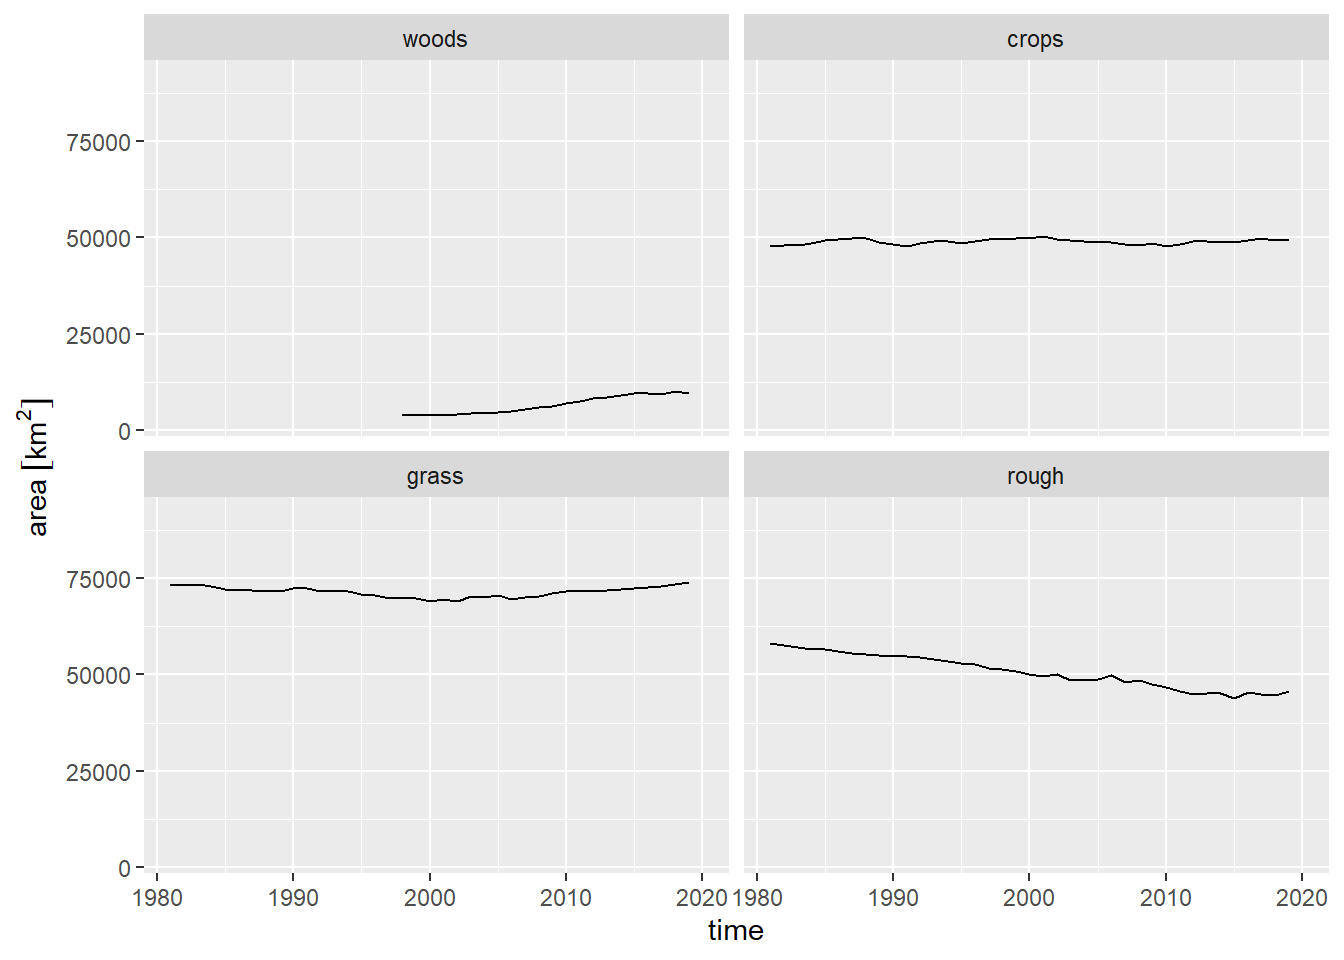
Figure 8.5: Time series of land use from the June Agricultural Census in the UK, 1980-2019.
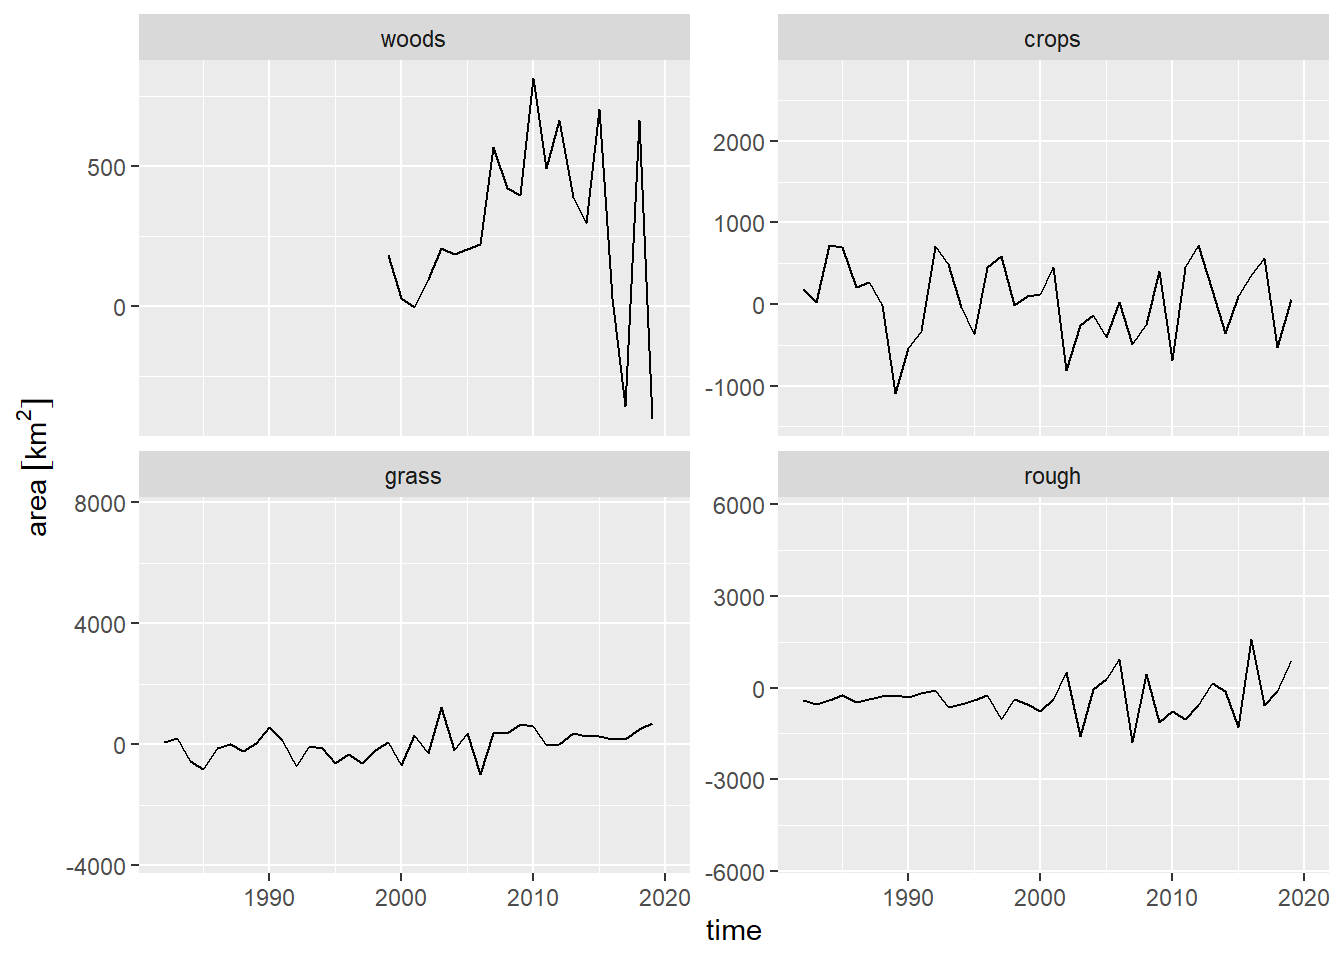
Figure 8.6: Time series of net land-use change from the June Agricultural Census in the UK, 1980-2019.
8.2 Agricultural Holdings Data
Survey data for agricultural holdings were supplied by Scottish Government for Scotland for the years 1990 to 2018. These data, which are the finest level of detail in the agricultural census, provide information on livestock numbers, crop and grass areas (and more) at the individual farm level (ca. 51,000 unique holdings). The data are compiled from an annual questionnaire to a sample population (ca. 20 – 50%) that undergoes periodic methodological changes (such as the questions asked or the categories used). From a spatial perspective, this dataset does not provide information beyond the registered location of the holding; the actual location of crops and grass is not provided. From 2008, the location of the holding is provided using the postcode (c. 80% of holdings – the other c. 20% are parish located) and prior to this, only the parish is provided.
The processing task had several steps. We firstly had to remove information not pertaining to crops and grass and standardise the remaining data. Given the diversity of information requested by the census over the years, it is challenging to ensure that changing questions and sub-types of various crop and grass types were standardised across the time series. Secondly, the locations of the holdings were extracted from the spatial information provided, dependent on the year. Holdings were located in the centroid of the parcel to which they were associated with. Where the parcel is a parish or postcode, this can represent a large spatial extent where we have very low-precision spatial information (particularly in NW Scotland where parishes and even postcodes are large areas. The data were re-categorised to the LULUCF classification and summed by specific XY location. The net change in area per LULUCF category from one year to the next was calculated for each unique XY location. Absolute values of gains and losses were separated and then interpolated via inverse distance weighting (Figure 8.7).
The data are the finest detail of agricultural ownership in Scotland and, when totalled, agree well with the national Agricultural Census. This is to be expected and the spatial information gained from the holding location (particularly postcodes), along with the detailed categories, is advantageous but limited. In Scotland this issue is magnified due to the large parish/postcode sizes in remote parts of the country. One of the principle problems with the data is that it is a survey, not a comprehensive census, sampling around half of farms in a normal survey year. Estimates are made for those holdings that are not surveyed based on trends. Census data are always exposed to error via misreporting from the respondent but this is not thought to be a significant source of error.
Figure 8.7: Spatial distribution of the gains and losses in arable land from Agricultural Census data in Scotland for 2017-2018. The map on the left shows the raw data for each agricultural holding. The map on the right shows an interpolation of this using inverse distance weighting.
The same analysis can be applied to the equivalent data for England, Wales and Northern Ireland, but permission to use the data for this project had still not been obtained at the time of writing. For the current analysis, the holding-level data for Scotland are used to estimate the spatial maps of the likelihood for each land use in a later section.