Section 5 Countryside Survey
The Countryside Survey (UKCEH 2020a) is a series of national (GB) field surveys carried out in 1984, 1990, 1998/99 and 2007 by the Centre for Ecology and Hydrology and the former the Institute of Terrestrial Ecology. The surveys consist of detailed field observations, collected in 1 km sample grid squares across Great Britain (384 squares in 1984, 508 in 1990 and 569 in 1998). Each successive survey resamples squares included in the previous survey. Around 0.24% of Great Britain’s land surface was surveyed in the 1998 survey (Barr et al. 2003). The sampling is stratified using a system of classifying geographical locations depending on many mapped attributes (‘ITE Landclass’).
The Northern Ireland Countryside Survey (DAERA 2016) was initiated in the late 1980s, with a baseline land cover survey in Northern Ireland. This estimated the area of different types of Primary Habitats from a random sample set of quarter kilometre grid squares. A monitoring resurvey was carried out in 1998 to determine the extent of change using the same sample grid squares and methods as in the baseline. A third time series of the NICS was carried out in 2007 to survey 287 grid squares.
The Countryside Survey (CS) classifies land use into so-called “Broad Habitats” (Jackson, 2000). The table below shows the correspondence between CS Broad Habitats and LULUCF classes.
| Broad.Habitat | LULUCF_ID | LULUCF_name | |
|---|---|---|---|
| 1 | Broadleaved and Mixed | 1 | forest |
| 2 | Coniferous Woodland | 1 | forest |
| 3 | Arable and Horticulture | 2 | crop |
| 4 | Improved Grassland | 3 | grass |
| 5 | Neutral Grassland | 4 | rough |
| 6 | Calcareous Grassland | 4 | rough |
| 7 | Acid Grassland | 4 | rough |
| 8 | Fen Marsh and Swamp | 4 | rough |
| 9 | Dwarf Shrub Heath | 4 | rough |
| 11 | Bog | 4 | rough |
| 12 | Inland Rock | 4 | rough |
| 13 | Saltwater | 0 | NA |
| 14 | Freshwater | 0 | NA |
| 15 | Supra-littoral Rock | 6 | other |
| 16 | Supra-littoral Sediment | 6 | other |
| 17 | Littoral Rock | 6 | other |
| 18 | Littoral Sediment | 6 | other |
| 19 | Littoral Sediment | 4 | rough |
| 20 | Built-up Areas and Gardens | 5 | urban |
For each CS 1-km survey square that coincided between survey years (544 in 1998-2007), the area that changed from one land-use class to another was calculated, using ArcGIS software. The \(\mathbf{B}\) matrix values were calculated by summing these for each land-use type.
To extrapolate the CS squares to national scale, the “ITE Land Class” was used, which represents a broad classification of environments across the UK. Northern Ireland is treated as a single uniform unit as its smaller area means that it does not display the climatic or elevation variations evident across the rest of the UK. A mean transition matrix was calculated for each ITE Land Class. The national-scale matrices were calculated as the mean over all ITE Land Classes, weighted by their area coverage. To interpolate between survey dates, we assumed that the rates of change were constant during the period between surveys.
The plots below show the estimates of land-use change produced by the Countryside Survey observations. The data are shown over the whole period available, 1970 to 2020
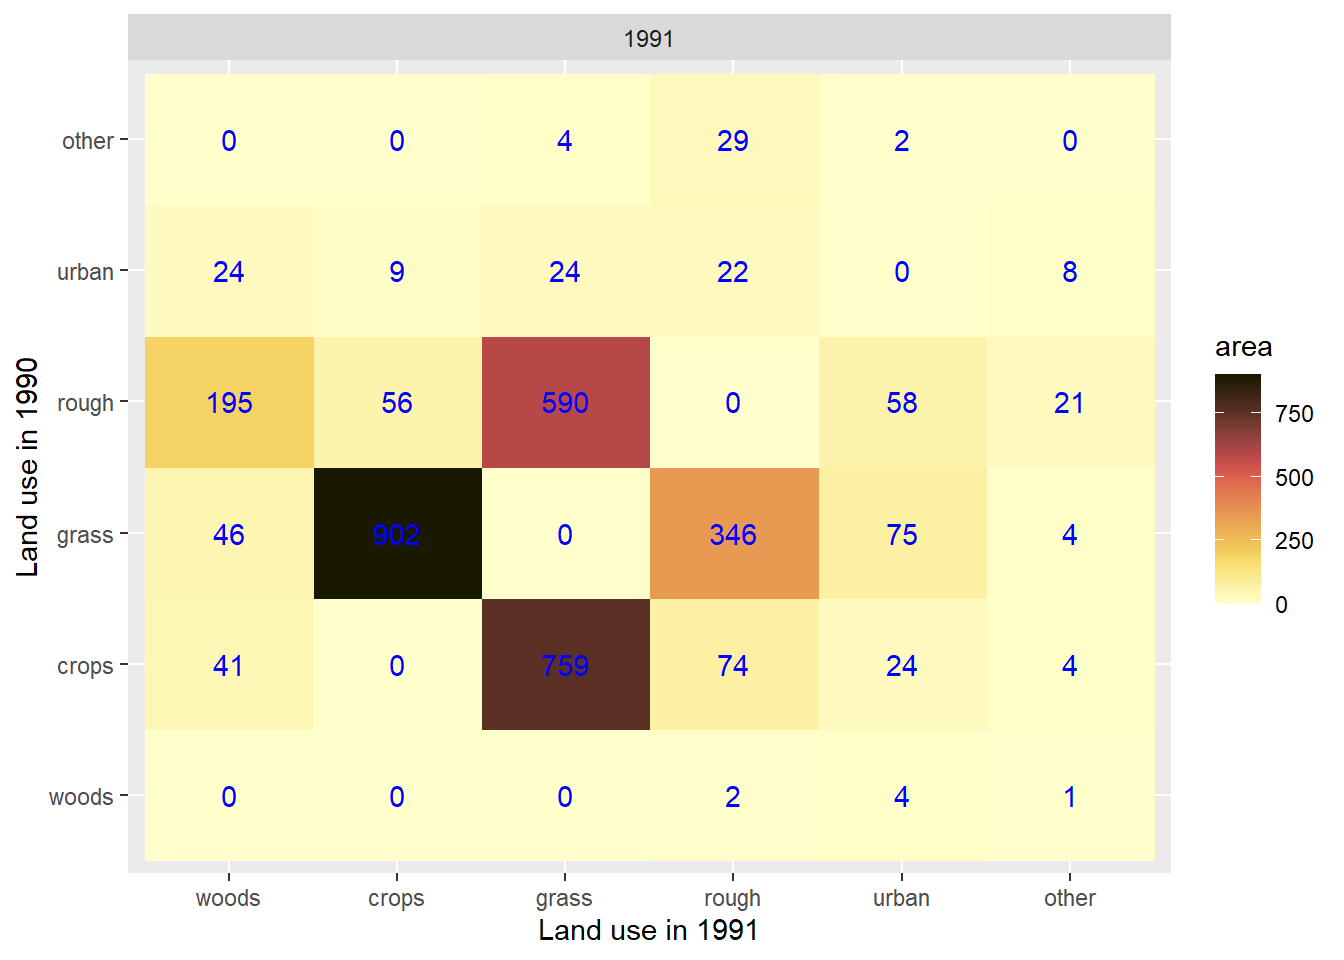
Figure 5.1: Example \(\mathbf{B}\) matrix showing the areas changing land use between 1990 and 1991 in km2.
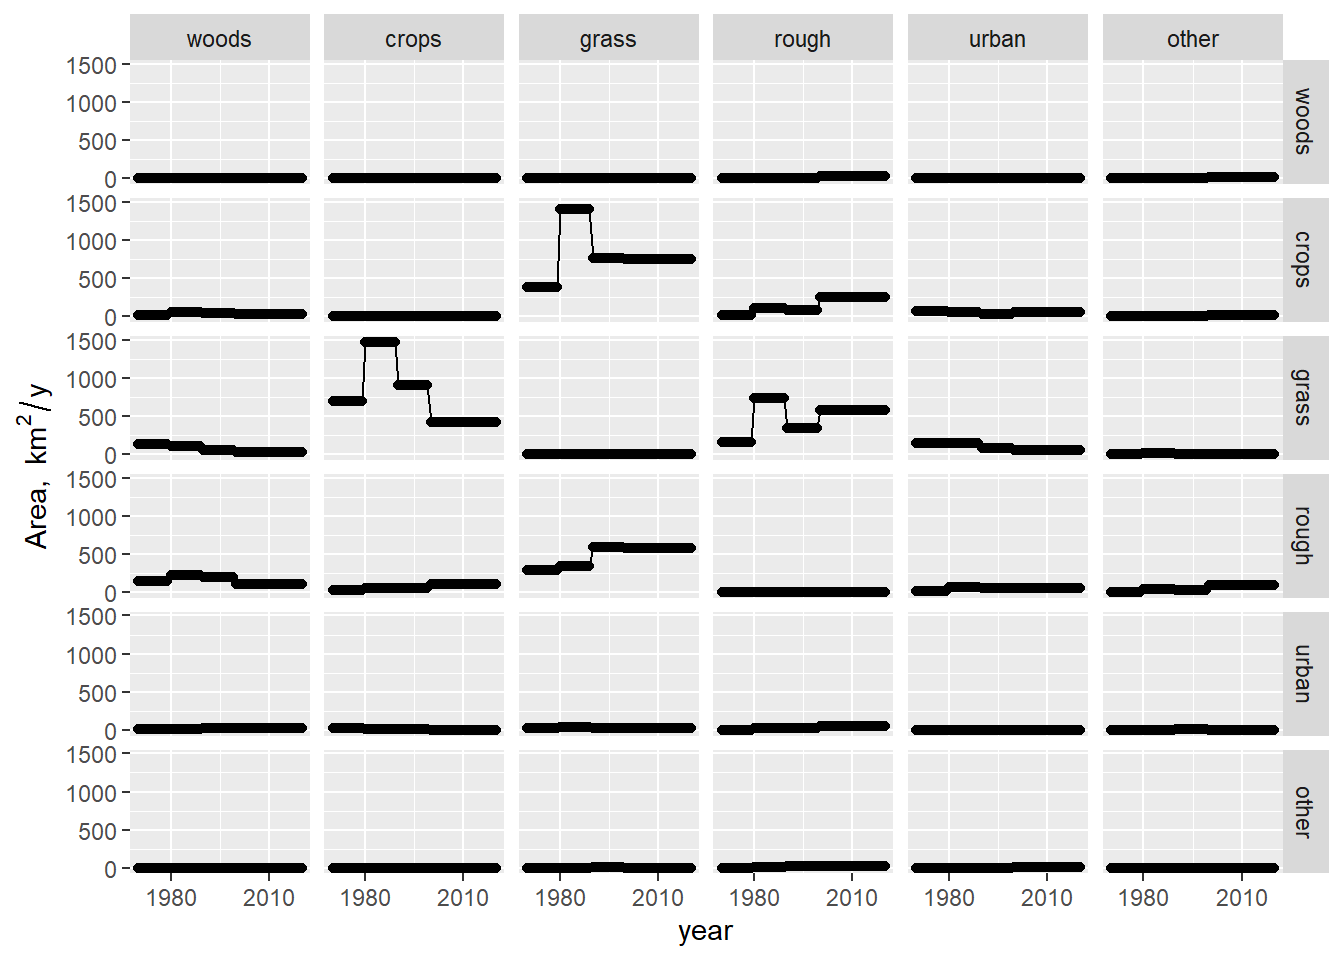
Figure 5.2: Time series of \(\mathbf{B}\) matrix, showing the areas changing land use over time. The layout of panels follows the matrix itself, so rows represent the starting land use, columns represent the end land use. We assumed that the rates of change were constant during the period between surveys.
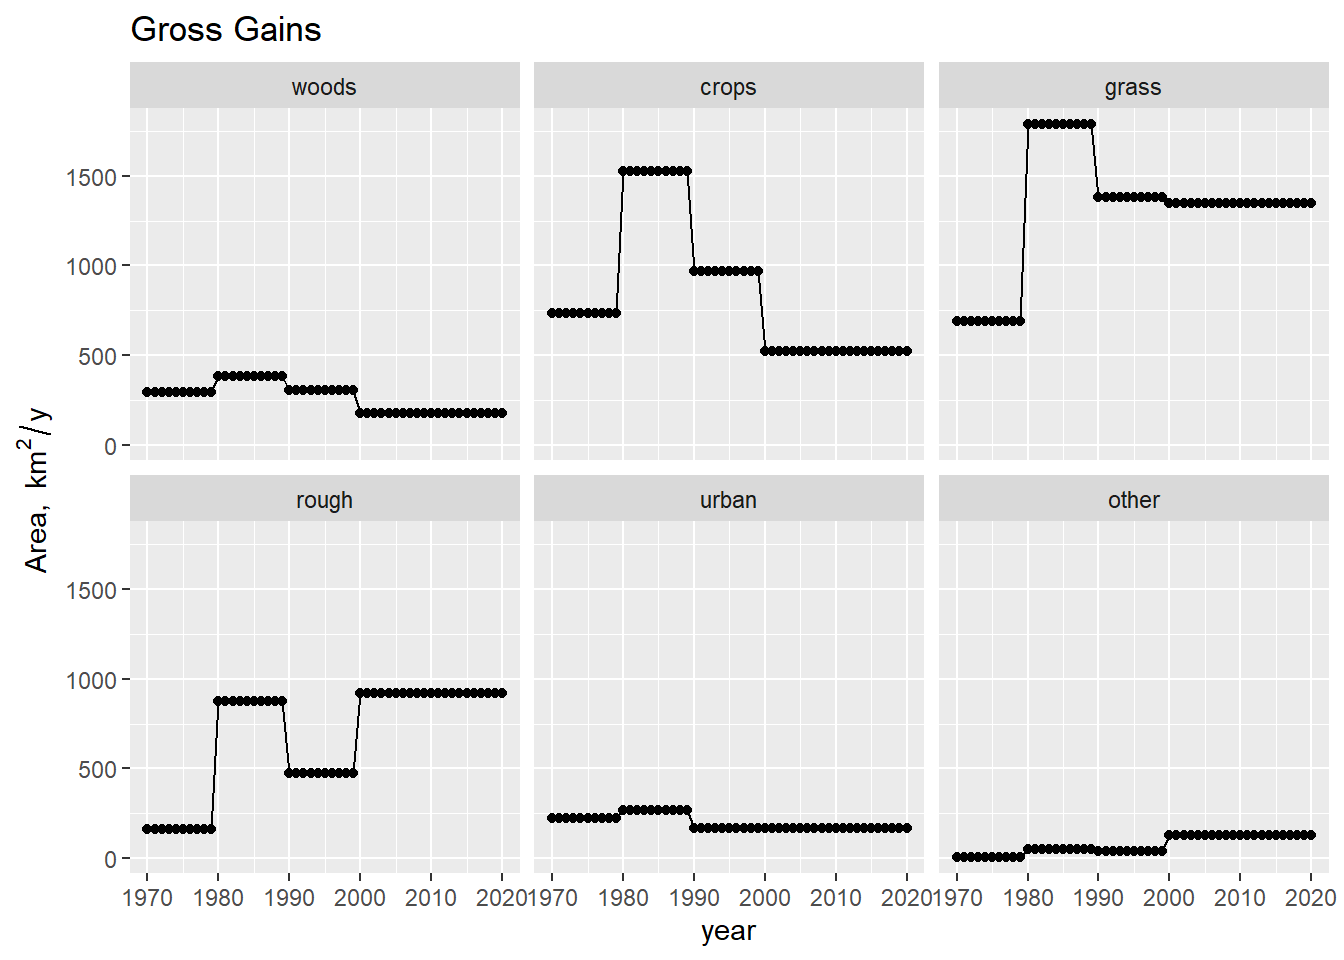
Figure 5.3: Time series of implied area gains \(\mathbf{G}\) to each land use, from CS data. We assumed that the rates of change were constant during the period between surveys.
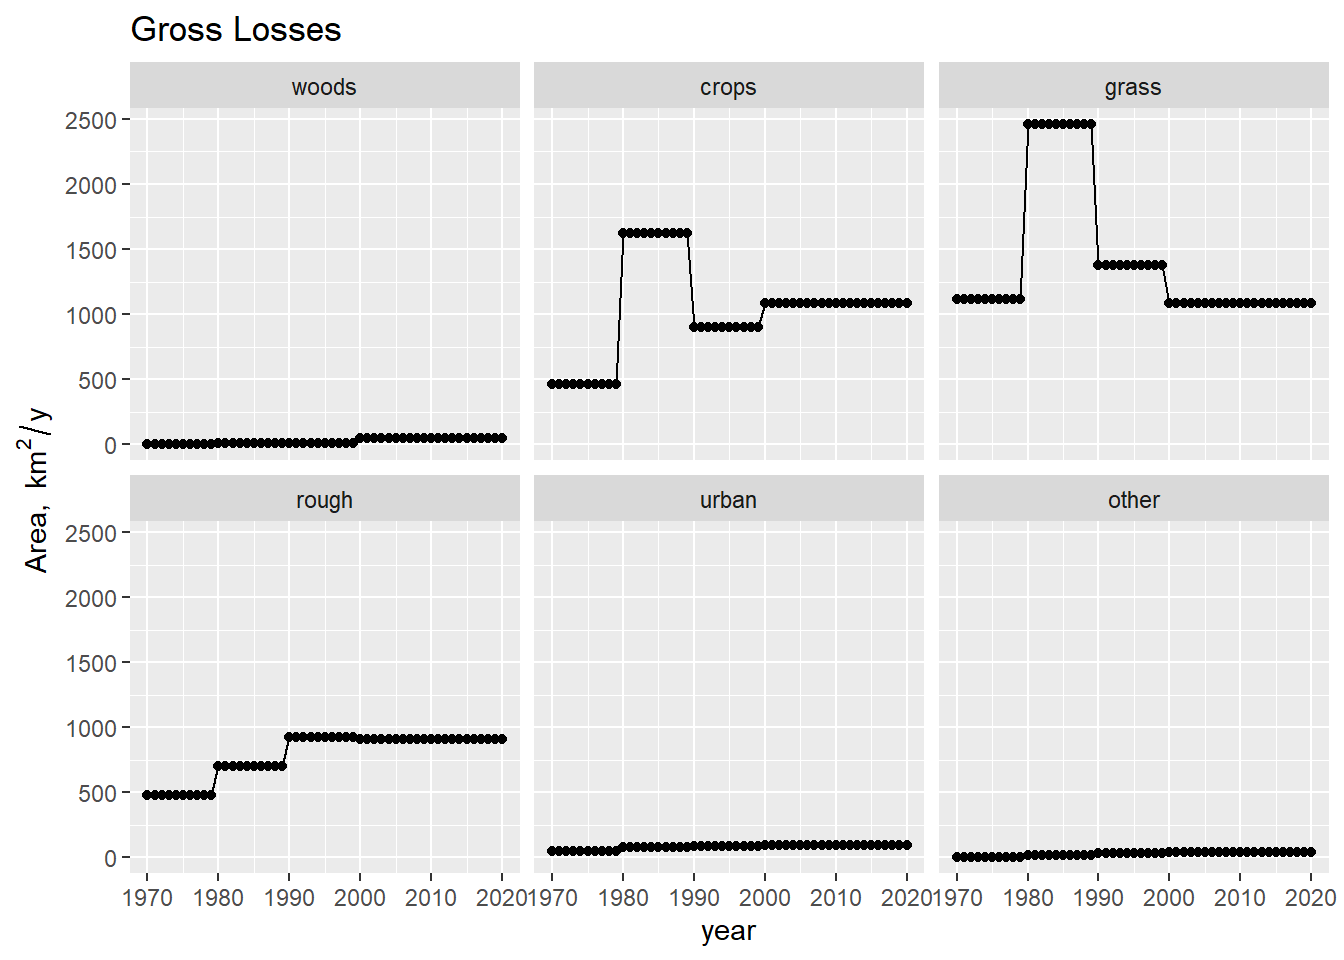
Figure 5.4: Time series of implied losses of area \(\mathbf{L}\) from each land use, from CS data. We assumed that the rates of change were constant during the period between surveys.
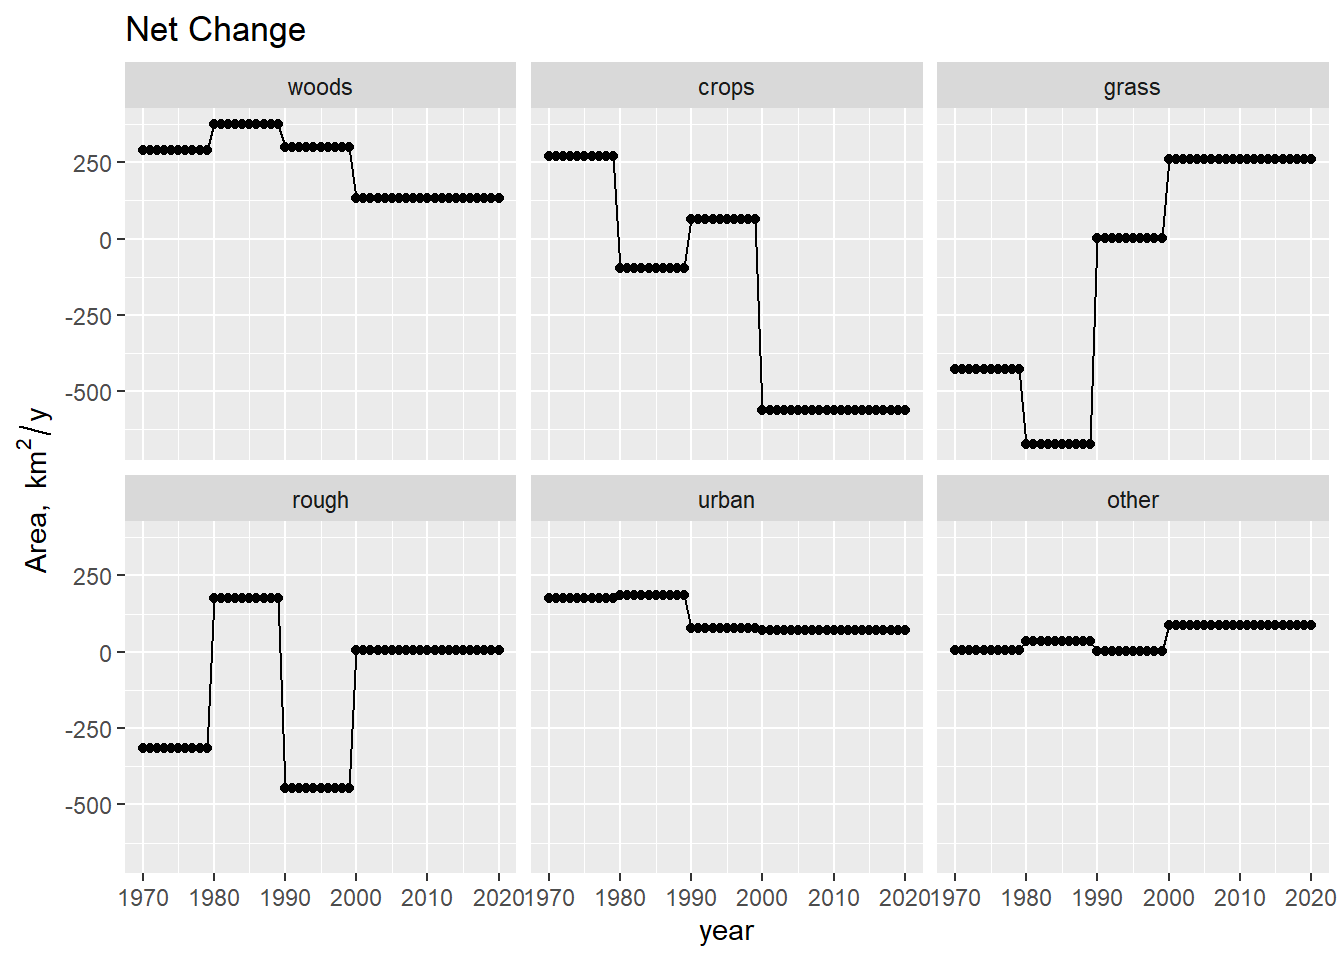
Figure 5.5: Time series of implied net change in area \(\Delta \mathbf{A}\) of each land use, from CS data. We assumed that the rates of change were constant during the period between surveys.
References
DAERA. 2016. “Northern Ireland Countryside Survey | Department of Agriculture, Environment and Rural Affairs.” DAERA. November 17, 2016. https://www.daera-ni.gov.uk/articles/northern-ireland-countryside-survey.
UKCEH. 2020a. “Countryside Survey.” EIDC. 2020. https://catalogue.ceh.ac.uk/id/2069de82-619d-4751-9904-aec8500d07e6.